The recently announced “mini-budget” made clear the government has prioritised economic growth and committed to an immediate cut in national insurance, whilst underwriting energy costs. This fiscal environment, combined with inflation, will almost inevitably result in a pressure on all public spending and a re-examination on where spending is directed. Recent announcements indicate that public sector budgets – including the NHS – will not be “topped up” to prevent a real-terms fall in budget, against a backdrop of rising inflation. This comes at a time when the NHS is already under immense budgetary pressure and has been struggling in terms of day-to-day operational pressure (and associated funding requirements).
New analysis by CF, undertaken on behalf of NHS Confederation, finds that growth in healthcare investment has a clear relationship with economic growth. This analysis has been made possible by bringing together, for the first time, longitudinal data from multiple sources linked at the local level across all of England.
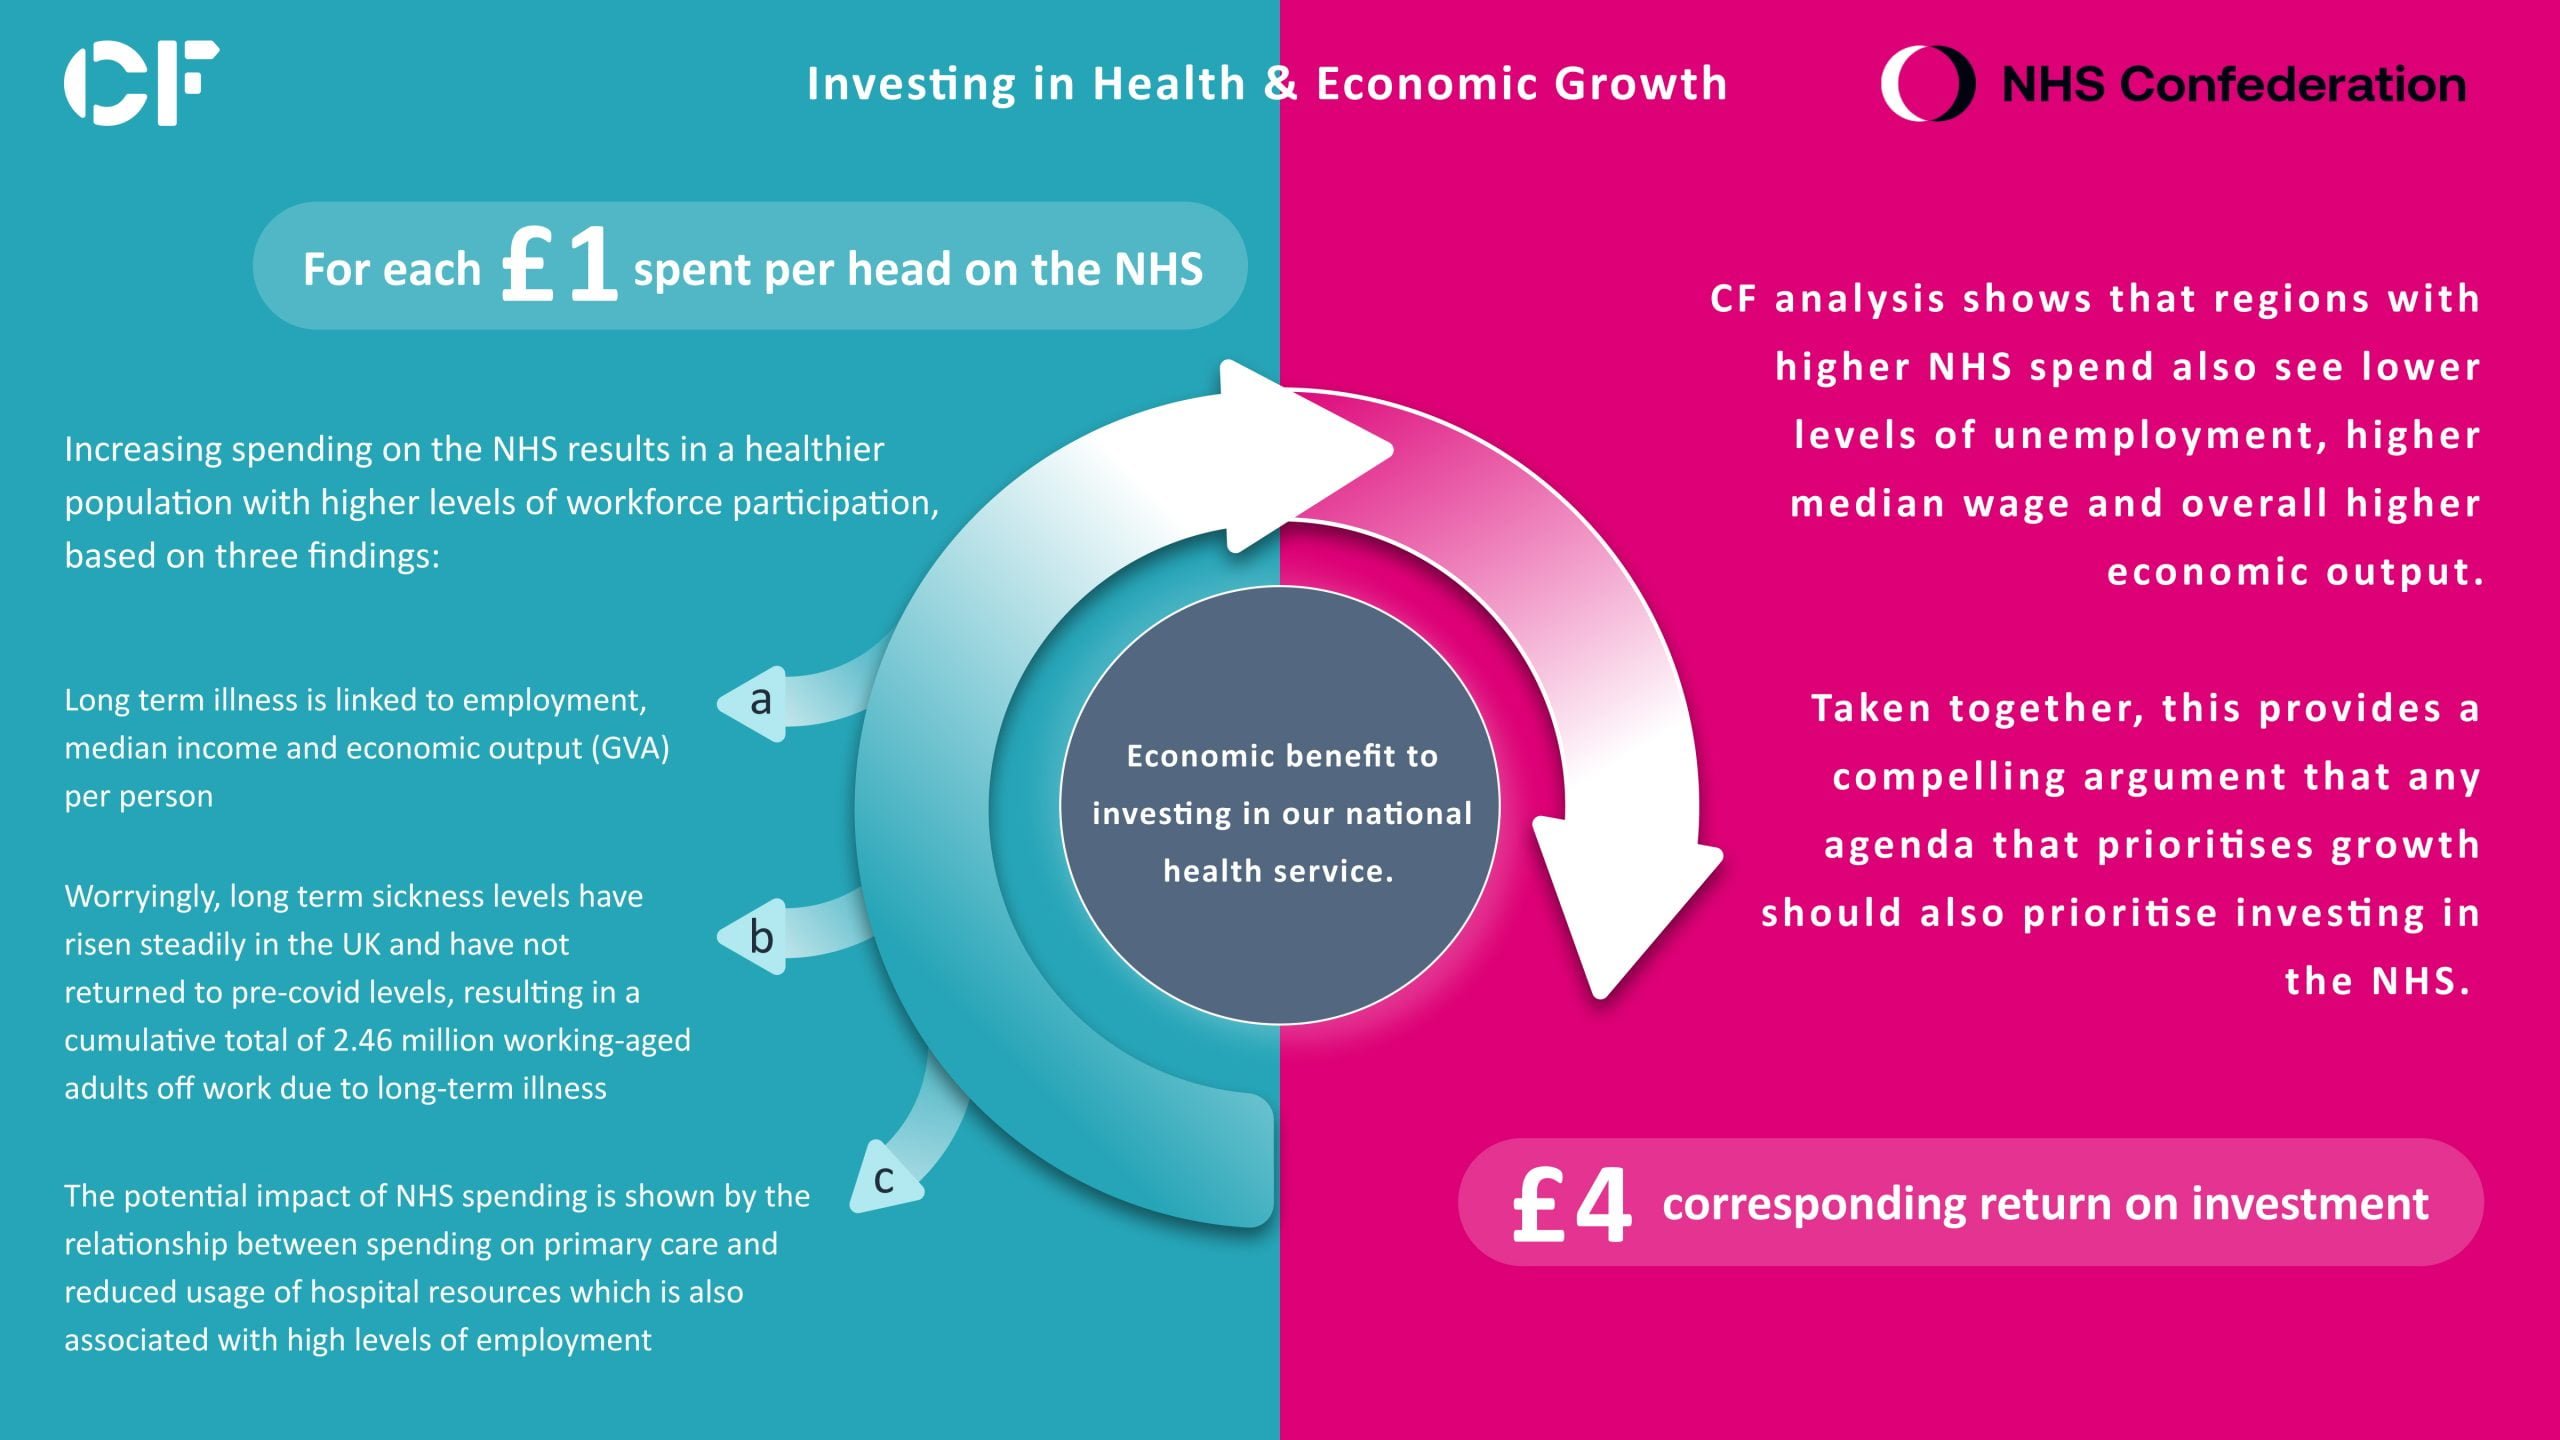
The main argument that health investment leads to economic growth is that increasing spending on the NHS results in a healthier population with higher levels of workforce participation, based on three findings:
- Long term illness is linked to employment, median income and economic output (GVA) per person
- Worryingly, long term sickness levels have risen steadily in the UK and have not returned to pre-covid levels, resulting in a cumulative total of 2.46 million working-aged adults off work due to long-term illness
- Investing in the NHS has potential to support the population to improve health. The most direct link we have observed is investing in primary care workforce shows links to reduced A&E attendances and non-elective admissions, both of which are signals of ill health and in turn influence workforce participation
In addition, the NHS itself has a powerful role as an employer. Half of NHS spending is on workforce and the NHS is the largest employer in England. The role of the NHS as an employer is especially important in more deprived areas.
This means that spending on the NHS should be regarded as an investment not a cost. Improving population health can drive higher levels of economic growth across the country.
Explore the research further below.
Click here to read Confed’s report.
Contents
- Executive summary
- Approach and data
- What the analysis found
- Conclusions and further questions
- Appendix: modelling, datasets and methodology
- Authors and contributors
01
Executive summary
£4
Economic return for every £1 spent per head on the NHS
2.46m
Working-age adults off work due to long-term illness
1.2m
NHS employees in England, making it the largest employer in the UK
The mini-budget of September 2022 made clear that the government has prioritised economic growth, committing to an immediate cut in national insurance while underwriting energy costs. That fiscal environment, combined with inflation, will almost inevitably put pressure on all public spending and prompt a re-examination of where spending is directed. Recent announcements indicate that public sector budgets, including the NHS, will not be topped up to prevent a real-terms fall against a backdrop of rising inflation. This comes at a time when the NHS is already under immense budgetary pressure and struggling with day-to-day operational pressure.
This analysis has been made possible by bringing together, for the first time, longitudinal data from multiple sources linked at local level across all of England. It shows that for each £1 spent per head on the NHS there is a corresponding return on investment of £4, an economic benefit to investing in the national health service.
The main argument that health investment leads to economic growth is that increasing spending on the NHS results in a healthier population with higher levels of workforce participation. Three findings support it:
- Long-term illness is linked to employment, median income and economic output (GVA) per person.
- Long-term sickness levels have risen steadily in the UK and have not returned to pre-covid levels, leaving a cumulative total of 2.46 million working-aged adults off work due to long-term illness.
- Investing in the NHS has the potential to support the population to improve health. The most direct link observed is that investing in primary care workforce is associated with reduced A&E attendances and non-elective admissions, both signals of ill health that in turn influence workforce participation.
The NHS also has a powerful role as an employer. Half of NHS spending is on workforce, and the NHS is the largest employer in England. That role matters most in more deprived areas.
Spending on the NHS should be regarded as an investment, not a cost. Improving population health can drive higher levels of economic growth across the country.
Sources: Health Foundation analysis of workforce and vacancy data from NHS Digital and Health Education England; BMA analysis of NHS England consultant-led referral to treatment waiting times statistics; ONS Labour Force Survey
02
Approach and data
What CF investigated
CF explored the relationship between an increase in NHS spend and an increase in gross value added (GVA) through two distinct analytical approaches. CF also explored a logical chain that could explain the relationship between those two end points.
The direct relationship
Increased NHS spend to increased GVA.
The underlying chain
Increased NHS spend, to increased NHS workforce, to better health outcomes, to a larger and more productive workforce, to increased GVA.
- CF expected the strength and nature of these relationships to vary between geographic regions, because of differences in working-age population and deprivation.
- Data was used at local level, meaning counties, unitary authorities or districts in England, to account for regional variation. This is ITL3 level, the internationally comparable regions.
- The approach was data-driven, and conclusions are based on current trends in both NHS and broader economic spend.
- Alternative approaches exist, including looking at the multiplier effect of NHS spend, but these were beyond the scope of this report.
The dataset
CF compiled a five-year longitudinal dataset at local level, bringing together this breadth of data for the first time.
| Category | Data included |
|---|---|
| Population | Mid-year population estimates; Indices of Deprivation (2019) |
| Workforce | NHS workforce statistics; General Practice workforce collection; national staff annual earnings estimates (March 2018) |
| Health spending | CCG allocations; national schedule of NHS costs (2021/22); weighted population needs at GP practice level and at CCG level |
| Healthcare activity and outcomes | Emergency Care Data Set (ECDS); Admitted Patient Care (APC) |
| Economic activity | Employment rate; economic inactivity; full-time workers gross hourly pay; balanced gross value added per head of population at current basic prices |
The questions and how they were answered
NHS spend accounts for over 90% of total health spend, so the analysis focuses there.
| Question | Data sources | Approach |
|---|---|---|
| What is the economic impact of £1 invested in the NHS? |
|
|
| By which mechanisms can NHS spend impact economic activity? |
|
Correlation and regression analysis of relationships between metrics including:
|
03
What the analysis found
Every £1 invested in the NHS translates into an economic return of £4 in the local area
To quantify the impact of NHS spend per head relative to need on GVA per head, CF chose methods that control for regional variation and temporal effects, and that provide evidence for a causal relationship.
- Fixed effects regression found that a £1 increase in NHS spend is associated with a £3.98 increase in GVA.
- For propensity score matching, the percentage increase in NHS spend per head between 2015/16 and 2019/20 was used to classify each ITL3 into three quantiles: low, medium and high.
- GVA per head is expected to increase over time, but the percentage increase is generally higher for ITL3s with a larger increase in NHS spend.
- By matching similar places and comparing the treatment effects, GVA increased on average by £4.12 for each additional £1 in NHS spend.
What £1 of NHS spend returns, by method
Increase in GVA per head from a £1 increase in NHS spend per head relative to need
Scale runs from £0 to £5 of GVA per head
Increase in NHS spend per head, by quantile
Needs-weighted, 2015/16 to 2019/20
0.9% – 2.0%
1.4% – 2.2%
1.4% – 2.8%
Scale runs from 0% to 3%. Bars show the 25% to 75% quantile range for each group.
Two different methods of analysis show that increases in NHS spending per head are associated with increased economic output per head.
Sources: NHS England, CCG allocations; ONS, gross value added (balanced) per head of population at current basic prices; GOV.UK, Indices of Deprivation; ONS, mid-year population estimates
Long-term illness is linked to employment, median income and economic output per person
CF performed multivariate regression analysis to investigate the underlying associations that may contribute to the relationship. Controlling for average Index of Multiple Deprivation score, the percentage of the population aged 65 and over, and variation over time, the analysis found that:
- A 1% decrease in the proportion of workers off due to long-term sickness, used as a proxy for general morbidity, is associated with a 0.45% increase in the employment rate. That corresponds to roughly 180,000 extra workers across the UK working population of around 40.2 million.
- A 1% increase in the employment rate is associated with a £292 increase in an area’s GVA per head.
- A 1% decrease in the proportion of workers off due to long-term sickness is associated with a £0.47 increase in median hourly pay.
Across ITL3s, long-term sickness plotted against employment gives a correlation coefficient of −0.65.
As a population gets healthier the employment rate increases, and so does the quality of the employment, with healthier workers able to pursue higher quality jobs.
Sources: NOMIS, annual population survey (employment rate and economic inactivity, 16 – 64); NOMIS, annual survey of hours and earnings, workplace analysis (full-time workers gross hourly pay); ONS, mid-year population estimates. Long-term sickness as a proxy for morbidity: Bambra and Norman (2006)
The number of people who have left the UK workforce due to long-term sickness keeps rising
The link between an effective healthcare system and a high performing economy is not controversial. If people are not healthy, they will not be well enough to work. People who are not currently working are far more likely to report poor health than those still in work, and a fifth of adults aged 50 to 65 who have left work are currently on an NHS waiting list for medical treatment.
- Almost two and a half million people have now left the UK workforce due to long-term illness, almost 500,000 more than in 2017. This might be expected given the pandemic, but the trend began before it, with the upward climb starting in 2019.
- The same trend has not been seen in other European and OECD countries, where the number of people outside the workforce is on a downward trend despite an initial increase.
Sources: ONS Labour Force Survey; Financial Times, “Chronic illness makes UK workforce the sickest in developed world”
Investing in primary care is associated with reduced A&E attendance and inpatient spells
To illustrate the potential impact of investing in NHS workforce, CF analysed the relationship between increasing the number of GPs per head, relative to need, and use of secondary care services. The figures control for average Index of Multiple Deprivation score and the percentage of the population aged 65 and over.
| Secondary care service | Estimated impact of one additional GP per 10,000 people, relative to need |
|---|---|
| A&E attendances per 10,000 people | −98 |
| Long-stay non-elective inpatient spells (two days or more) per 10,000 people | −10 |
The salary cost of employing an extra GP ranges between roughly £65,000 and £98,000. With an average A&E attendance cost of £297 and an average long-stay non-elective inpatient spell cost of £4,842, these estimates would reduce costs by around £82,000 through the reduction of non-elective activity alone.
£65,000 – £98,000
Scale runs from £0 to £100,000 a year. Saving counts reduced non-elective activity only.
These direct cost reductions matter, but there will be other wider benefits too. Further research could explore whether similar impacts follow from increases in other areas of health and care provision, for example mental health resource, and could help identify the best places for investment.
Sources: NHS Digital, General Practice workforce collection; Hospital Episode Statistics, Emergency Care Data Set; Hospital Episode Statistics, Admitted Patient Care; NHS England, national schedule of NHS costs; NHS Health Careers, pay for doctors; ONS, mid-year population estimates
Lower hospital activity levels are also associated with higher employment and pay
Alongside the direct savings from reducing secondary care activity, CF investigated whether a reduction in that activity is associated with increased economic activity. Controlling for average Index of Multiple Deprivation score, the percentage of the population aged 65 and over, and variation over time:
- A decrease of 100 A&E attendances per 1,000 population per year is associated with a 0.5% increase in the employment rate.
- A decrease of 10 long-stay non-elective inpatient spells per 1,000 population is associated with a £0.54 increase in median hourly pay.
Across CCGs, A&E attendances plotted against employment give a correlation coefficient of −0.49.
Sources: NOMIS, annual population survey; NOMIS, annual survey of hours and earnings, workplace analysis; ONS, mid-year population estimates
The NHS as an employer affects economic growth, particularly in more deprived areas
- Between 45% and 50% of NHS spend is on workforce, with workforce numbers increasing alongside NHS spend.
- There is a correlation between the level of deprivation in an area and the contribution of NHS workforce expenses, for acute, mental health and community care, to total GVA. The correlation coefficient is 0.55.
- In the least deprived areas the NHS constitutes just 1% of GVA. In the most deprived areas it accounts for at least four times that amount.
The NHS cannot single-handedly bring economic development to an area, but it can generate economic activity, and that is particularly true where deprivation is higher.
Technical note: to estimate the contribution of NHS workforce expenses, CF multiplied the NHS workforce in acute, mental health and community organisations by the average NHS wage in NHS trusts and CCGs for March 2018 (£30,852).
Sources: NHS Digital, NHS workforce statistics; ONS, gross value added (balanced) per head of population at current basic prices; GOV.UK, Indices of Deprivation; NHS Digital, national staff annual earnings estimates; ONS, mid-year population estimates
04
Conclusions and further questions
More work is needed to understand whether all types of health spend have the same impact, or whether spend should be prioritised within specific areas.
The core conclusion, that increased spending on health increases GVA, is significant and suggests that real benefits can be seen from increasing NHS spend at the current level of spending. This observation holds for behaviour close to the current state. A vastly different amount or distribution of spend would require new analysis.
The analysis demonstrates a link between increased NHS spend and NHS workforce, health outcomes, workforce participation, and therefore GVA and economic growth.
There is good evidence, here and in other work, that the ability of primary care to support population health management interventions creates higher returns on NHS spend, through reduced secondary care costs and improved population health. The policy implication points to prioritising primary care. With the current GP shortage, integrated care systems are having to think creatively about how to secure the workforce needed to deliver primary health care.
- Do other areas of health spending have a similar impact in targeted areas, whether by sector, such as mental health or social care, or by kind of spending, such as capital or IT?
- This work did not explore other linkages such as the multiplier effect of procurement, or the return on investment in health research. Previous work has shown that NHS spend also contributes to GVA through these mechanisms, supporting the case for treating health spending as an investment.
05
Appendix: modelling, datasets and methodology
Modelling approach
Two methods were used to determine the impact of NHS spend per head, relative to need, on GVA per head.
| Modelling method | Impact on GVA per head from a £1 increase in NHS spend per head relative to need |
|---|---|
| Fixed effects regression | £3.98 |
| Propensity score matching | £4.12 |
Fixed effects regression
By controlling for temporal effects, regression analysis can show the impact of NHS spend on GVA. The regression takes the form Yit = βXit + αi + εit, where:
- Yit is the outcome variable, GVA per head, for a given ITL3 (i) and year (t).
- β is the coefficient for the regression variables Xit, in this case spend per head relative to need, and time in years.
- αi is the fixed effects associated with factors such as IMD, and εit is the error term.
Propensity score matching
- Propensity score matching estimates the effect of a treatment or intervention, and is used for causal inference.
- This question does not lend itself neatly to that approach, because treated and control groups are hard to define.
- Using proxies, the analysis was able to show that increasing health spend has a positive effect on GVA. It was performed to assess the reliability of the regression output, and reported similar values.
Datasets
| Dataset | Source | Granularity used | Key assumptions and limitations |
|---|---|---|---|
| CCG allocations | NHS England | Financial year; setting (core services, primary care, specialised); allocation | GP practice level weighted population was used to distribute CCG-level funding across ITL3s. GP practices were assigned to ITL3s by geographical location. |
| Weighted population needs (GP practice level) | NHS England | GP practice; calendar year (2015 and 2018 only); total weighted population including SMR<75 adjustment | Weighted populations are calculated every three years. Linear interpolation was used for the intermediate years. |
| Weighted population need (CCG level) | NHS England | CCG; calendar year; projected weighted population need | 2015 weighted populations were projected to subsequent years using ONS population growth projections. |
| Gross value added (balanced) per head at current basic prices | Office for National Statistics | ITL; ITL code; calendar year; GVA per head | Some ITL3s, such as Westminster, diverged significantly from the general values observed. All ITL3s with GVA above the 95th percentile were removed. |
| Mid-year population estimates | Office for National Statistics | Local authority and CCG (2020 geography); population estimate | Not applicable |
| Employment rate | NOMIS, annual population survey | Local authority (2021 geography); financial year; age group 16 – 64; people employed; total people of working age | Employment rate was projected from local authority to ITL3 using a working-age population weighted average. |
| Economic inactivity | NOMIS, annual population survey | Local authority (2021 geography); financial year; age group 16 – 64; reason for inactivity; number of people not seeking work | ONS population estimates of working-age population were used to convert from raw value to rate. |
| Full-time workers gross hourly pay | NOMIS, annual survey of hours and earnings | Local authority (2021 geography); number of jobs included; hourly pay per job, per decile | Gross hourly pay was projected from local authority to ITL3 using a working-age population weighted average. |
| Indices of Deprivation (2019) | GOV.UK | LSOA (2011 geography); Index of Multiple Deprivation score | 2019 values assumed constant across all years. IMD scores were projected from local authority to ITL3 using a population weighted average. |
| NHS workforce statistics | NHS Digital | Month; organisation code and name; setting; staff group; FTE | Average monthly FTE between April and March was used for each financial year. Workforce is provided for trusts, not sites, and trusts were assigned to ITL3s by geographical location. Analysis restricted to acute, mental health and community settings. |
| General Practice workforce collection | NHS Digital | Practice code and name; total GP FTE | Practices were assigned to CCGs by geographical location. |
| Emergency Care Data Set | Hospital Episode Statistics | CCG responsibility; financial year; attendances | Not applicable |
| Admitted Patient Care | Hospital Episode Statistics | CCG responsibility; financial year; admission method; bed days | Admission method was used to split spells into elective and non-elective. Bed days were used to split non-elective spells into short stay (under two days) and long stay (two days or more). |
| National schedule of NHS costs (2021/22) | NHS England | Services; average unit cost | National average used for all areas. |
| National staff annual earnings estimates (March 2018) | NHS Digital | Staff group; mean annual basic pay per FTE | March 2018 national average used for all areas and years. |
Methodology
| Analysis | Data used | Methodology | Assumptions and limitations |
|---|---|---|---|
| Fixed effects regression of GVA per head as a function of NHS spend per head over time | Dependent variable: GVA per head. Independent variables: overall NHS spend per head (needs weighted population); time in years. | Fixed effects regression allows for differences between ITL3s. Demeaned values were used in OLS regression. | Linear regression does not describe a causal relationship. There is no guarantee that GVA increasing with spend occurs because increased spend causes increased GVA. |
| Propensity score matching to find the difference in GVA increase for similar ITL3s with small or large NHS spend increases | Propensity score features: age composition of population; IMD. Treatment comparison: overall increase in NHS spend per head; overall increase in GVA per head. | ITL3s were separated by percentage increase in spend per head over 2015/16 to 2019/20 into low, mid and high groups. The high increase group was defined as treated and the low increase group as control. Propensity score similarity was used to find pairs and compare the increase in GVA per head per pound increase in NHS spend. | There are no true treated and control groups; heuristics were used to estimate proxy groups. The confidence intervals were not small enough to present this as a standalone result, but it does provide evidence of a positive causal relationship. |
| Calculation of contribution to GVA from NHS wages | NHS workforce in acute, mental health and community settings; average NHS wage; GVA; IMD. | The number of staff was multiplied by the average wage to determine the percentage of GVA this comprises for each region, then correlated across ITL3s with IMD. | March 2018 average annual basic pay represents the average wage of a staff member across all regions and time periods modelled. Accounts for the direct contribution of wages to GVA only. |
Regression analyses of the underlying relationships
Each of the following used linear regression, and also included IMD, age composition of population and time in years as variables. All p-values are below 0.05.
| Analysis | Dependent variable | Independent variable of interest |
|---|---|---|
| A&E attendances predicted from GPs per head | A&E attendances per 10,000 population | GPs per 10,000 needs-weighted population |
| Long-stay non-elective inpatient spells predicted from GPs per head | Inpatient spells per 10,000 population | GPs per 10,000 population weighted on need |
| Employment rate predicted from A&E attendances | Employment rate | A&E attendances per 10,000 population |
| Median hourly pay predicted from long-stay non-elective inpatient spells | Median hourly pay | Inpatient spells per 10,000 population |
| Employment rate predicted from workers off for long-term sickness | Employment rate | Proportion of workers off from long-term sickness |
| Median hourly pay predicted from workers off for long-term sickness | Median hourly pay | Proportion of workers off from long-term sickness |
| GVA per head predicted from employment rate | GVA per head | Employment rate |
These analyses are not intended to give a comprehensive view of every factor affecting the dependent variables. The interest is in the relationship between the independent variable of interest and the dependent variable. A linear relationship is assumed throughout.
06
Authors and contributors
Authors
- Ben Richardson, Managing Partner and co-founder at CF. Ben leads the Life Sciences and Data Sciences businesses, and has 23 years of experience leading major healthcare programmes across the globe.
- Bev Evans, Expert Partner at CF. Bev has operated at board level in a number of roles, as both Executive and Non-Executive Director in provider, commissioner and regulatory bodies, with a strong track record of delivery as a former NHS Finance Director.
- Will Browne, Associate Partner at CF. Will began his career in tech start-ups, where he developed his skills as a data scientist before managing software teams as a product manager. His consultancy career began at BCG, as a senior data scientist.
- Bec Gray, Data Scientist at CF. Bec specialises in dynamical systems and statistical modelling, as well as machine learning, and holds a PhD in Mechanical and Aerospace Engineering from Princeton University.
- Matt Brown, Consultant at CF. Matt has a particular interest in health inequalities and innovative solutions to improve NHS service provision and productivity. He joined CF after completing an MEng in Civil Engineering from the University of Cambridge.
Contributors
- Josh Lomax, Manager at CF
- Guy Cochrane, Manager at CF
- Emma Wilde, Consultant at CF