
At our recent hackathon, CF developed a mapping tool allowing users to explore potential inequalities in population and health metrics across each Integrated Care System (ICS). We combined our consulting, clinical and technical expertise to develop a tool that makes the relevant data accessible, understandable, and easy to visualise, drawing on our previous experience developing award-winning health equality tools. Try out the tool via this link.
In this blog post, we discuss our focus for our most recent hackathon, what we created, and how we think our tool can bring benefit to the NHS and the populations the NHS services locally.
What is a Hackathon?
A hackathon is a day of concentrated development where teams work together to quickly bring an idea to the minimum viable product (MVP) stage. Hackathons encourage innovation and creativity, provide a risk-free environment to try new frameworks or approaches, and can provide a chance to experience more collaborative ways of working together.
At CF, the Data Innovation (DI) team aim to host a Hackathon every three months, and some of the MVPs developed during our past Hackathons have been further developed into mature products. Our previous successes include the Insights and Collaboration Engine (ICE) tool (link), a tool to help ICSs develop strategy and track improvements, and the Health Access Explorer (link to case study/TL if exists), a tool used to assess equity of access to NHS services. We enjoy the satisfaction of seeing an idea come to fruition within a day and enjoy the freedom and creativity that having constraint-free development time brings.
What inspired this Hackathon?
Previously, the CF DI team have built multiple products designed to identify and help users address health inequalities, including the Vaccine Inequalities Tool (read more here) and Actionable Insights. On top of these projects that specifically focus on health inequalities, we believe it is critical to include these considerations in every project we do. At our Ethnic Inequalities in Mental Health symposium in May this year, one of our speakers Patrick Vernon talked about the importance of baking equity into every system, rather than thinking about it as an additional consideration.
The NHS has published the 2022/23 priorities and operational planning guidance, stating that one of the focuses for ICSs is to tackle inequalities in patient outcomes, experience, and access1. The guidance highlights the central role of effective use of data and analytics to improve access and health equity for under-served communities.
With this in mind, we decided to focus the most recent Hackathon on creating tools that make inequalities analysis more accessible, and to codify the analysis processes the consulting teams use across projects to support NHS organisations. We saw this as an opportunity to bring together expertise from our DI and consulting teams to share insights and expertise relating to the different ways these teams approach inequalities analysis.
What did we build?
The August Hackathon was conducted by three teams, focusing on:
- Creating maps to visualise population data and easily identify potential inequalities
- Codifying the inequalities analysis conducted by the consulting team on NHS Hospital Episode Statistics (HES) data
- Automating reports on data completeness of HES data for fields related to population characteristics such as ethnicity and deprivation
The team focusing on maps created a simple tool to visualise a series of metrics relating to population characteristics and outcomes for each Integrated Care System (ICS), as well as to measure the correlation between the various metrics. For instance, Greater Manchester ICS has a high negative correlation coefficient (-0.63) between the Index of Multiple Deprivation (IMD) and deaths from all causes. It can be inferred that as the IMD increases, deaths from all causes decrease, as a higher IMD represents a lower level of deprivation within a system. The tool enables the user to view the Lower-layer Super Output Areas (LSOAs) within an ICS and identifies the specific areas that have higher overall deprivation and higher mortality, as shown in Figure 1 below.
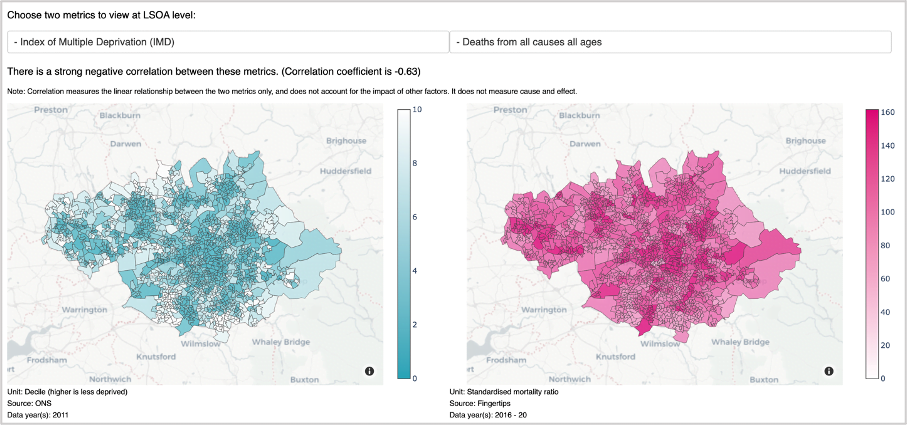
Figure 1: Screenshot of metrics shown in the tool
Although correlation is a simplistic measure and does not explain causation, we believe that this tool is a helpful first step to arm ICSs with relevant data on health inequalities within their locality. Systems can easily identify which measures should have efforts focused on and how these compare to other systems. The tool provides an easy way to explore the distribution of population and health outcome metrics within an ICS.
How can the tool be used?
The tool helps users to understand relationships between different measures visually, which improves the ability to easily spot patterns across an ICS. The findings from the tool will not immediately solve health inequalities, but these can prompt further targeted analysis and investigation within systems that can be used to do so.
In our other work, we have achieved this by helping to pinpoint where health inequalities exist and have supported the NHS and Local Authorities to address these. We have helped organisations explore specific issues in areas of focus and determined If the cause lies in challenges with communication and access and developed recommendations to how these can be addressed.
We hope this tool provides an easy-to-use application users might find interesting and helpful. If you would like to discuss the tool further, or to discuss addressing health inequalities utilising other measures, please contact [email protected].

Bec Gray is a senior data scientist at CF

Amira Kaskasoli is a consultant at CF

Tom Brogden is an analyst at CF

Will Browne is an associate partner at CF and leads our Data Innovation team
Sources


")
