New research by CF highlights that the level of integration and outcomes seen in an ICS are strongly related to the level of deprivation. Simply put, it remains the case that it is harder for places of high deprivation to achieve high levels of integration and outcomes. That said, context is not destiny. At every level of deprivation, there are visibly different levels of integration and outcomes. ICSs need to use data to understand their starting point and set their ambitions.
The stated purpose of Integrated Care Systems (ICSs) is to meet health and care needs across an area, coordinate services to improve population health, and reduce inequalities. As ICSs stand up amidst the strain of recovery from covid, renewed financial pressure, and workforce challenges, they have little shared intelligence to guide them in this journey. A wider consideration than covid cases, beds, wait lists, and clock starts is needed to ensure sustainable integration across services within systems.
To enable ICSs to reflect on their level of integration, CF developed an ICS Insight & Collaboration Engine (ICE), with the Institute of Public Policy Research (IPPR), which considers the level of service integration and outcomes across the three ‘chasms’ that were cited in the NHS Long Term Plan:
- physical and mental health
- community based care and hospital-based care
- health and social care
It does this by taking 40 selected indicators across these three chasms and creating an overall index based on equal weighting within each chasm and across the three The indicators were selected in collaborative work with IPPR and CF as good composite markers of service integration on the one hand and outcomes on the other. The data used was sourced from Public Health England and NHS Digital and has been ingested, cleansed and indexed in a format that can be updated routinely and is able to drill down to more granular level.
This level of analysis and insight allows ICSs to understand their starting point, prioritise areas that require the greatest attention, support the development of plans and metrics for improvement, and measure progress over time and across systems. While system is a critical unit as it is where the new ICSs exist and have new powers, but the constituent places and neighbourhoods are critical elements that need to be understood. Indeed, we know that there can be as much variation within systems as between them.
The metrics we include in this are shown below.

The indicators identified here are those related to integration across the three chasms that the NHS Long Term Plan set out as the basis for existence and set-up of ICSs. The list is non-exhaustive and does not include entire categories of measures that are in the System Oversight Framework, such as: leadership, staff satisfaction, and finance. It also does not include measures of specific policies or a heavy focus on waiting times themselves. The reason for this is that we have tried to define measures that support systems in addressing integration—as opposed to purely a performance management tool. We appreciate that various stakeholders who may find this tool useful may have a different view of the best measures to include or exclude. The engine we have created is flexible and can change in what is ultimately included, appropriate to the users’ context.
The key finding that emerges from the analysis of the data is that the degree of service integration and outcomes (as measured by the selected indicators) varies strongly with deprivation. The chart below shows the relationship between the “integration index” and Indices of Multiple Deprivation (IMD). The horizontal axis is IMD (higher deprivation being higher IMD) and the vertical is the integration index (centred on zero as median for England). The downward sloping line is the line of best fit in this relationship between IMD and integration. One way of looking at this is what is on this line is what might be expected given IMD and being above the line is achieving greater levels of integration and outcomes than might be expected due to deprivation.

This chart is available in interactive format at https://icstl.cfdata.io/
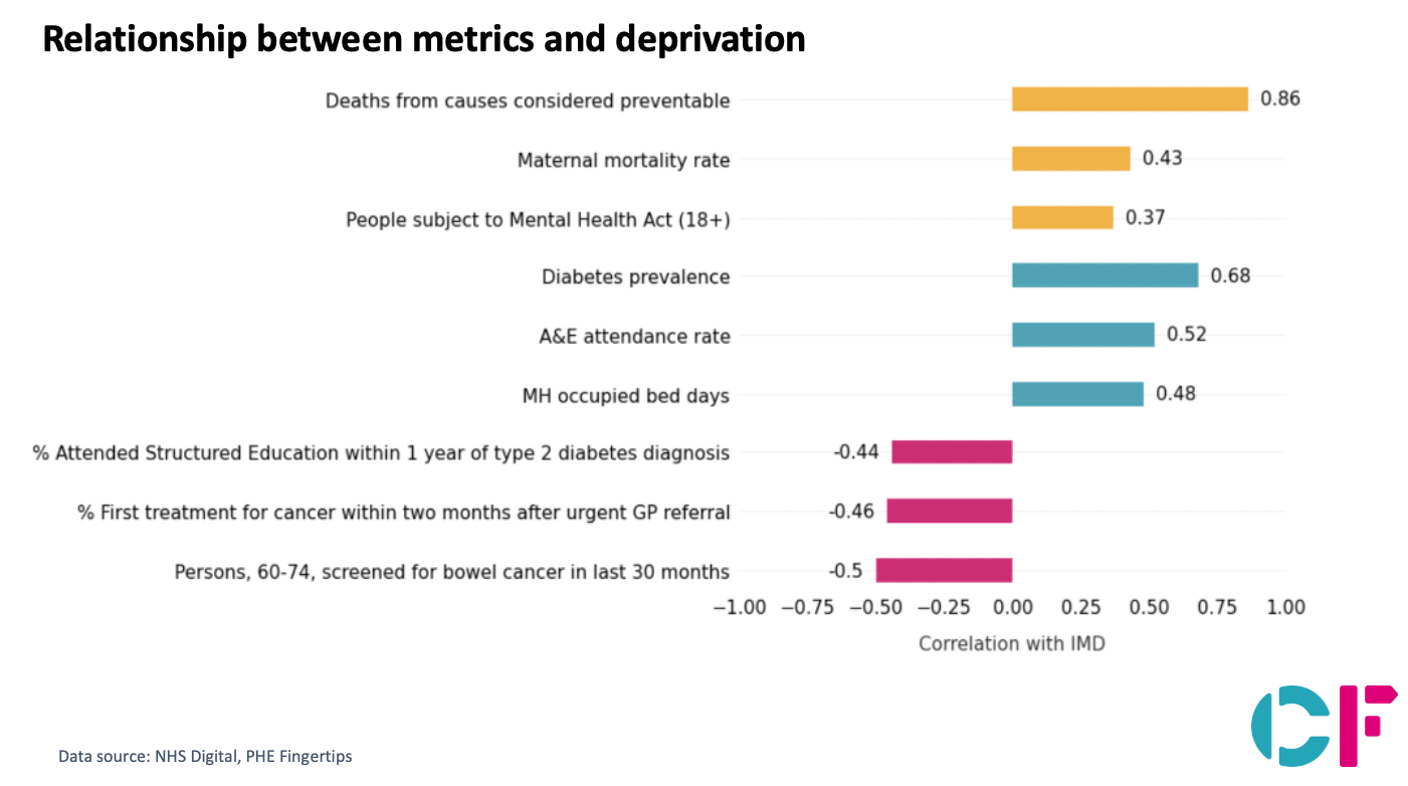
We have also examined the relationship of the individual metrics with deprivation. As deprivation increases, we see a proportional linear increase in deaths from causes considered preventable, maternal mortality, rate of people detained under the Mental Health act, and use of NHS resources including A&E attendance and Mental Health occupied bed days.

In conclusion, we believe that it is critical that ICSs, and ICPs in the local places within them, are armed with robust shared data and relevant analysis like this tool provides, to help them understand their starting point, help set aspirations, metrics, and goals and track these over time; and develop their strategies ready for execution. Current analysis suggests IMD critically influences the complexity of integrating services. Equally, it shows that there is such variation amongst integration between ICSs with similar deprivation levels, such that context need not be destiny. Each ICS and Place across England should seek to identify where and how it can integrate better for its population.
Interested to know more about how your ICS does?
To read more click here
Get in touch. [email protected]


