Executive summary
In October 2022, CF and NHS Confederation published research which examined the return on investment of NHS spending on economic growth and found that every £1 spent on the NHS corresponds to an approximate economic benefit of £4, highlighting that health expenditure should be viewed as an investment to stimulate economic growth.
Building on this foundational study, CF conducted further analysis on behalf of the NHS Confederation to discern how this return on investment differed across various care settings. The aim was to equip system leaders with insights into the implications of spending decisions on the local economy.
An analysis of five-year longitudinal data, including of economic and NHS spending, brought to light these key findings:
- There is a statistically significant difference between economic growth in those areas able to increase spend by the least and those able to increase it by the most, in community, primary and acute care
- Increasing spend on community and primary care had the largest effect on economic growth
- The UK could have missed out on between £10 and £14 billion in additional growth if an extra £1 billion had been invested in community, primary or acute care in those areas which increased spend by the least. Indeed, this would mean that this investment would have paid for itself in terms of return to the NHS
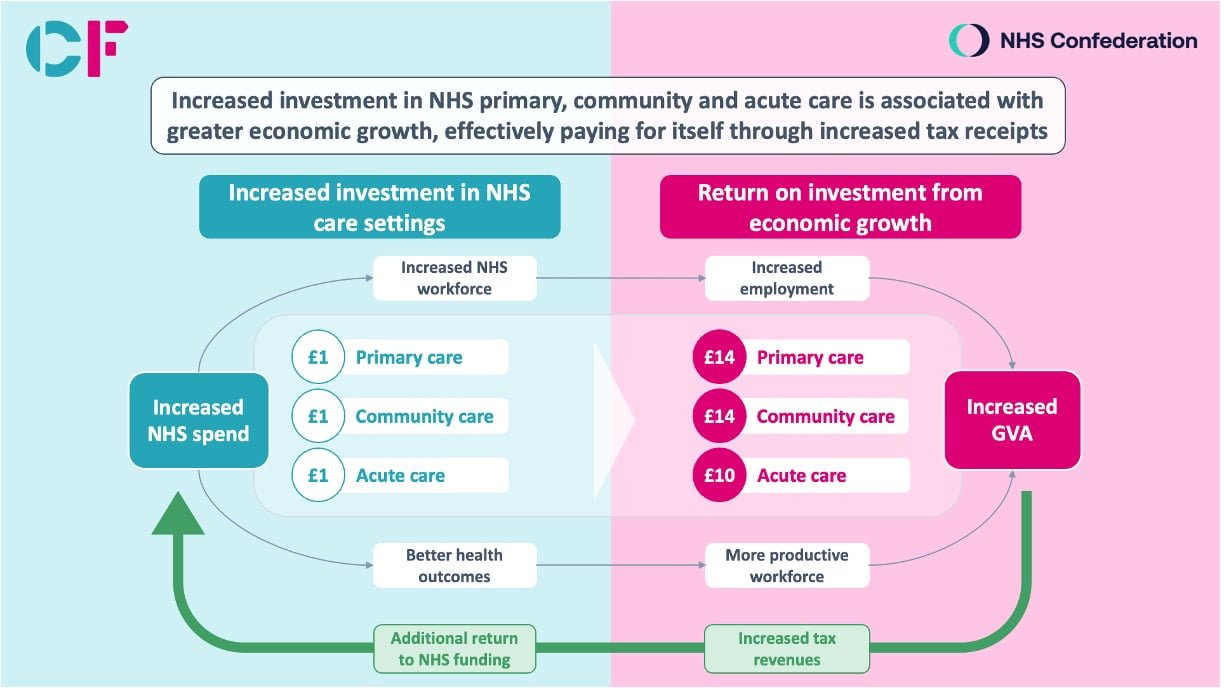
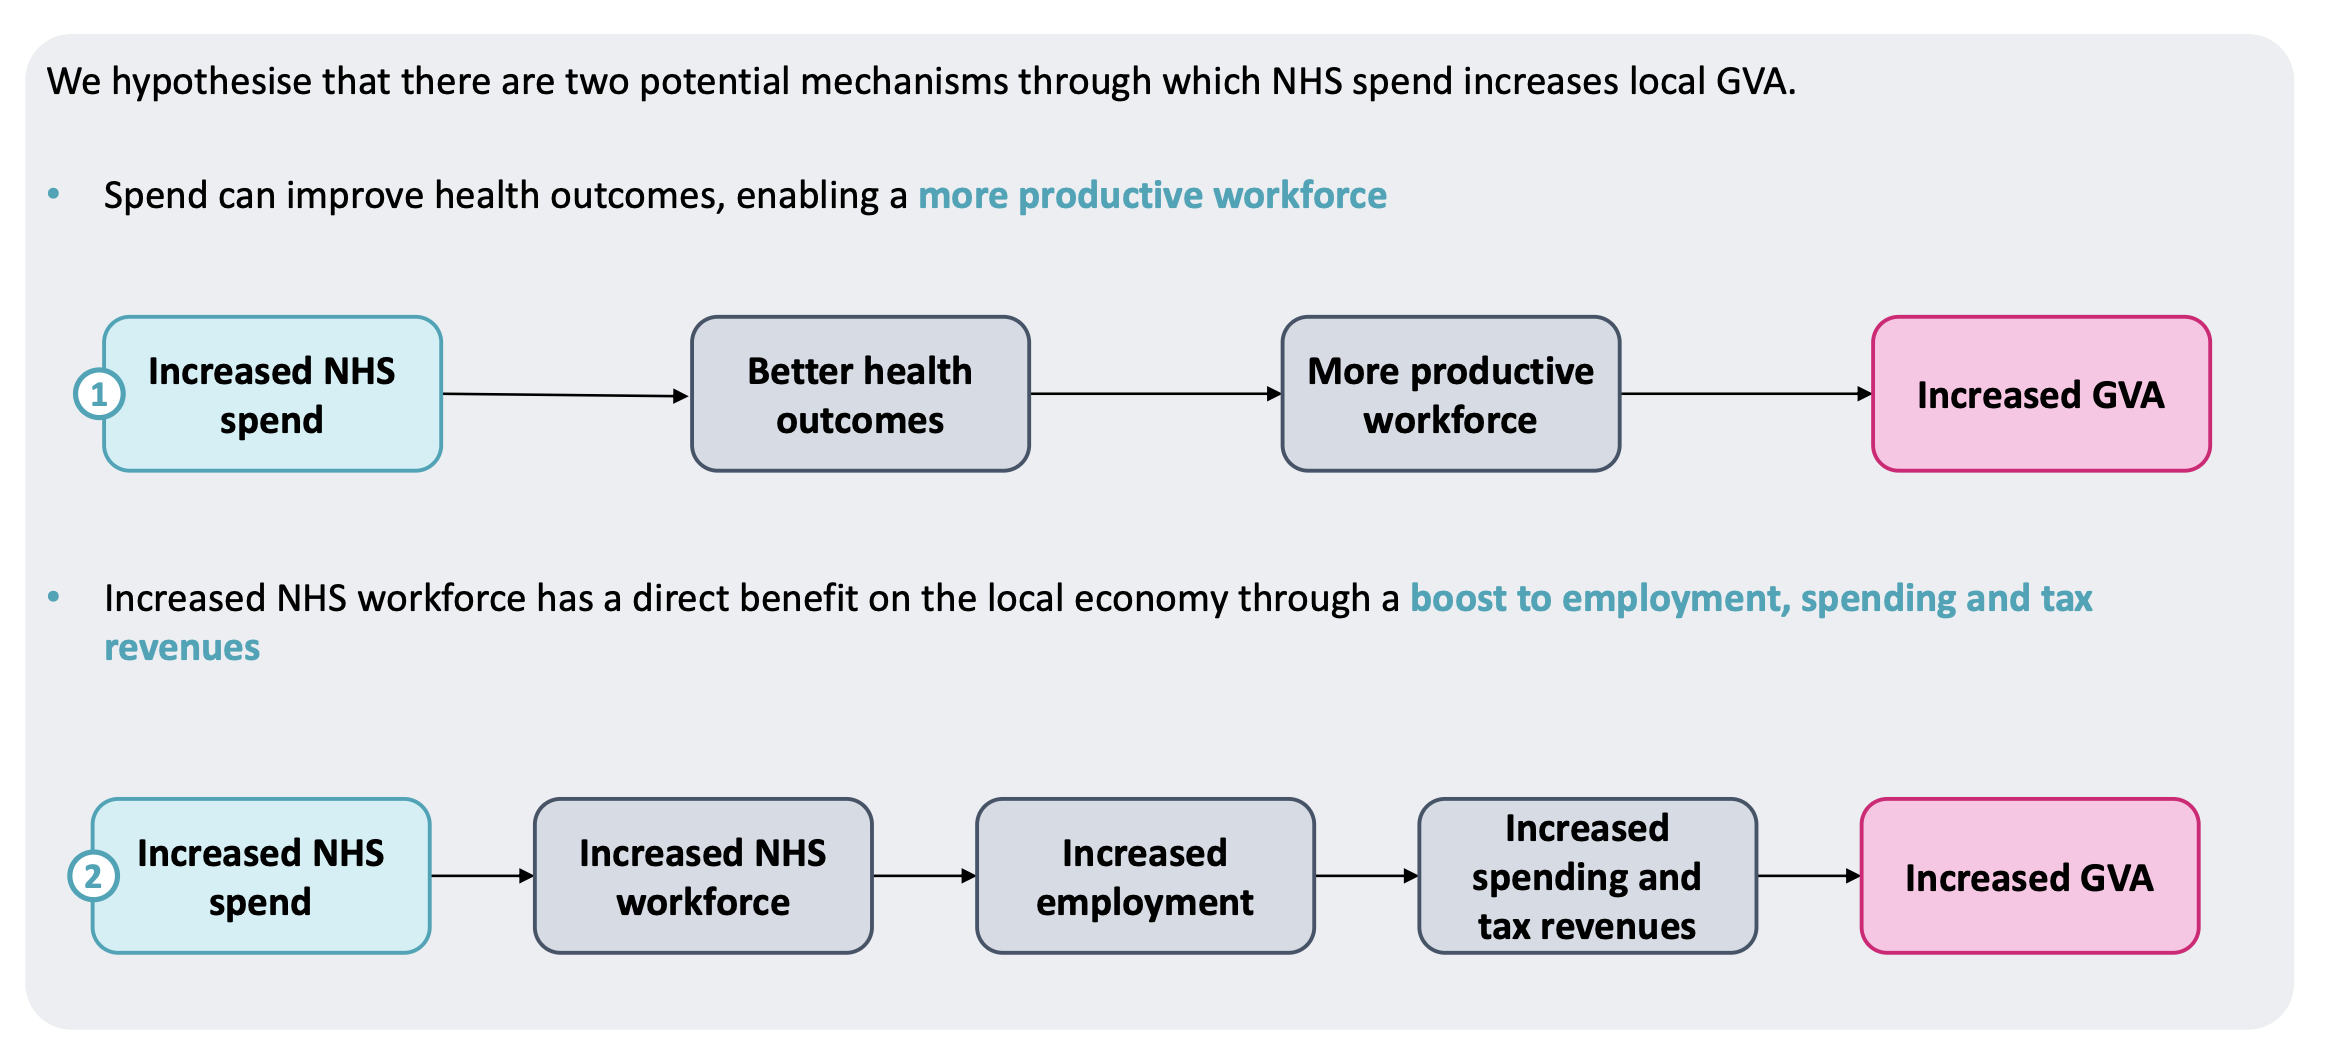
There are two potential mechanisms through which NHS spend can increase local Gross Value Added (GVA):
- Improved health outcomes through enhanced and improved capacity enables a more productive workforce by reducing sickness due to ill health and improving health outcomes
- Increased NHS workforce has a direct benefit on the local economy through a boost to employment, spending and tax revenues – those newly employed by the NHS pay tax, and stimulate the local economy through consumption
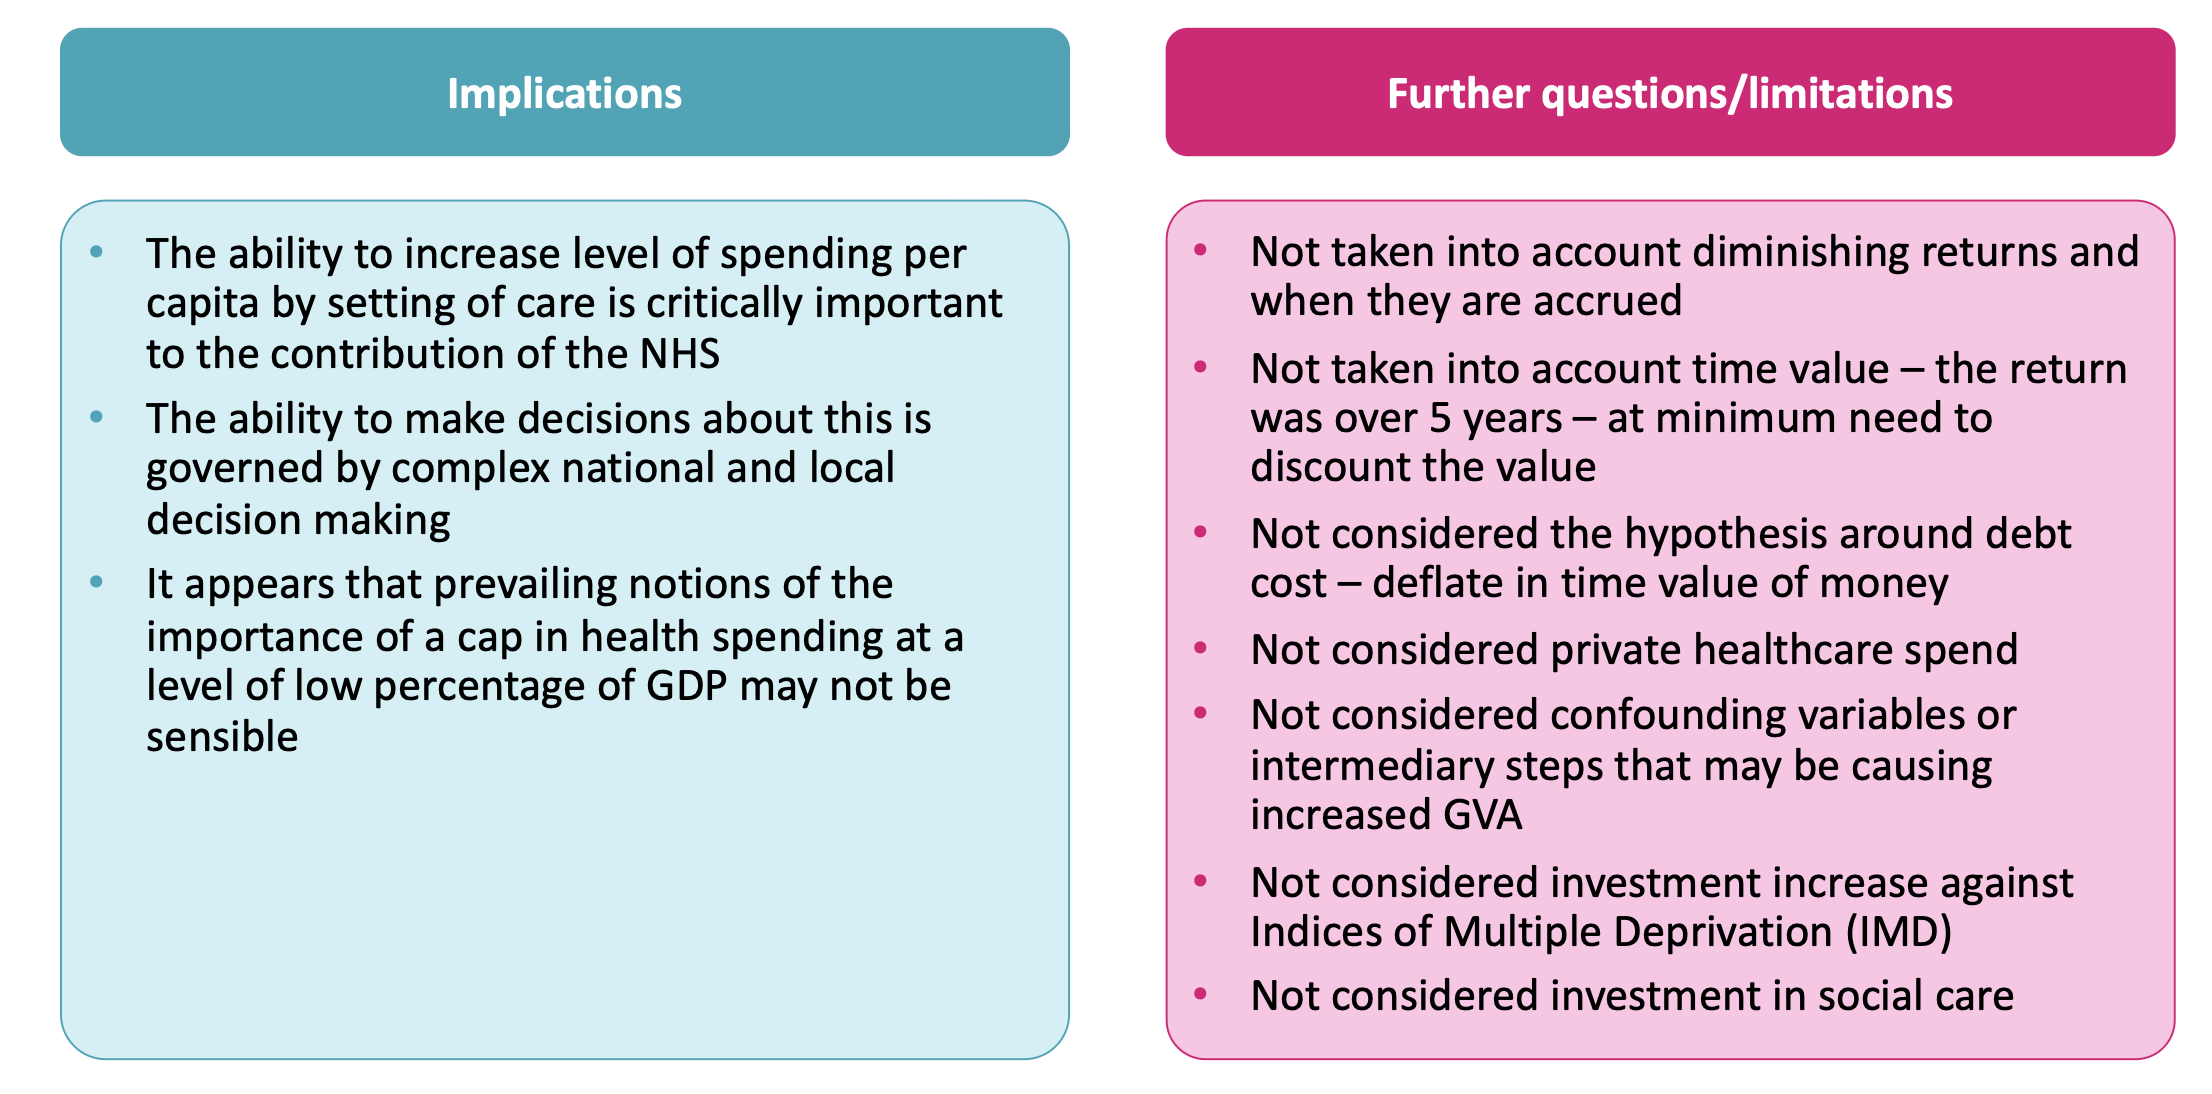
On the assumption that the tax burden and distribution of public spending remain similar to today, we estimate that the size of the impact in the areas which increased spend by the least is such that it would pay for itself in community, primary and acute care.
Findings from this analysis would imply the following recommendations:
- Treasury should treat annual government spending on the NHS as an explicit tool of economic development
- NHS England should prioritise any additional NHS spending in non-acute settings
- ICS leaders should be given a greater degree of flexibility in how they allocate their resources to support systems to explicitly create ‘health value’
In understanding these findings it is important to recognise the following:
- Variation in spend is locally determined: There is a high degree of variation in spend per weighted population by area – this variation is locally determined as, although there is a national formula for weighting, substantial local discretion exists in each care setting
- We have assumed a one-year time lag before the impact of economic growth starts materialising because both mechanisms stand to have relatively swift effects
- New jobs that are created in the NHS will be reflected as additional economic activity to a certain extent
- Our previous work on interventions to support public health management revealed a 1-3 year timeframe for these to translate into improved outcomes
Introduction
We have analysed how changes in spend relate to economic growth
We have examined how changes in spend by sector for historic CCGs are related to growth in Gross Value Added (GVA). We compared the change in GVA between 2015 and 2019 for those areas which, between 2014/15 and 2018/19, increased their spend by the most and those which increased spend by the least for each of our four subject settings of care.
- We have calculated spending by sector using historic CCG spending data, between 2014/15 and 2018/19. This data was adjusted for inflation, and hereon is presented in 2022 real terms. We have used CCG spend data as more granular local data is unavailable.
- Different areas have different populations with different needs. This can make comparison difficult. In order to compare diverse areas, we have weighted spend to the appropriate needs-weighted populations calculated by NHS England. As such, spending figures are phrased as ‘spend per needs-weighted head’. It must be noted that it is possible for spending to be higher or lower than needs due to a) historical pattern, b) deliberate investment choices.
- In order to compare changes in spend with economic growth, we have used Gross Value Added (GVA) at a CCG level, a measure of the total economic value generated in an area, released by the Office of National Statistics. We have assessed GVA in the second calendar year of each financial year, to allow for a lag in the effect of spend on economic outcomes.
We found that higher increases in spending were associated with higher economic growth
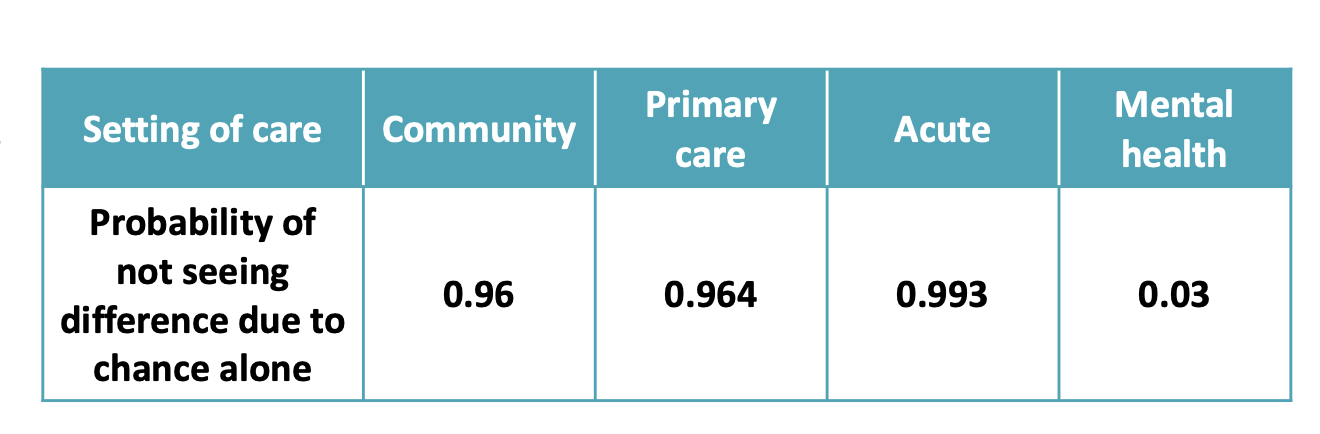
We compared GVA growth between 2015 and 2019 for CCGs which increased spending by the most and by the least, between 2014/15 and 2018/19. We found that areas which increased spend by the most between 2014/15 and 2018/19 for community, primary and acute care experienced statistically significant additional growth in GVA, relative to those which increased spend by the least. These increases were largest for community and primary care, where areas which increased spend by the most experienced additional GVA growth of more than £900 per head. We did not observe a statistically significant difference in GVA growth for mental health.
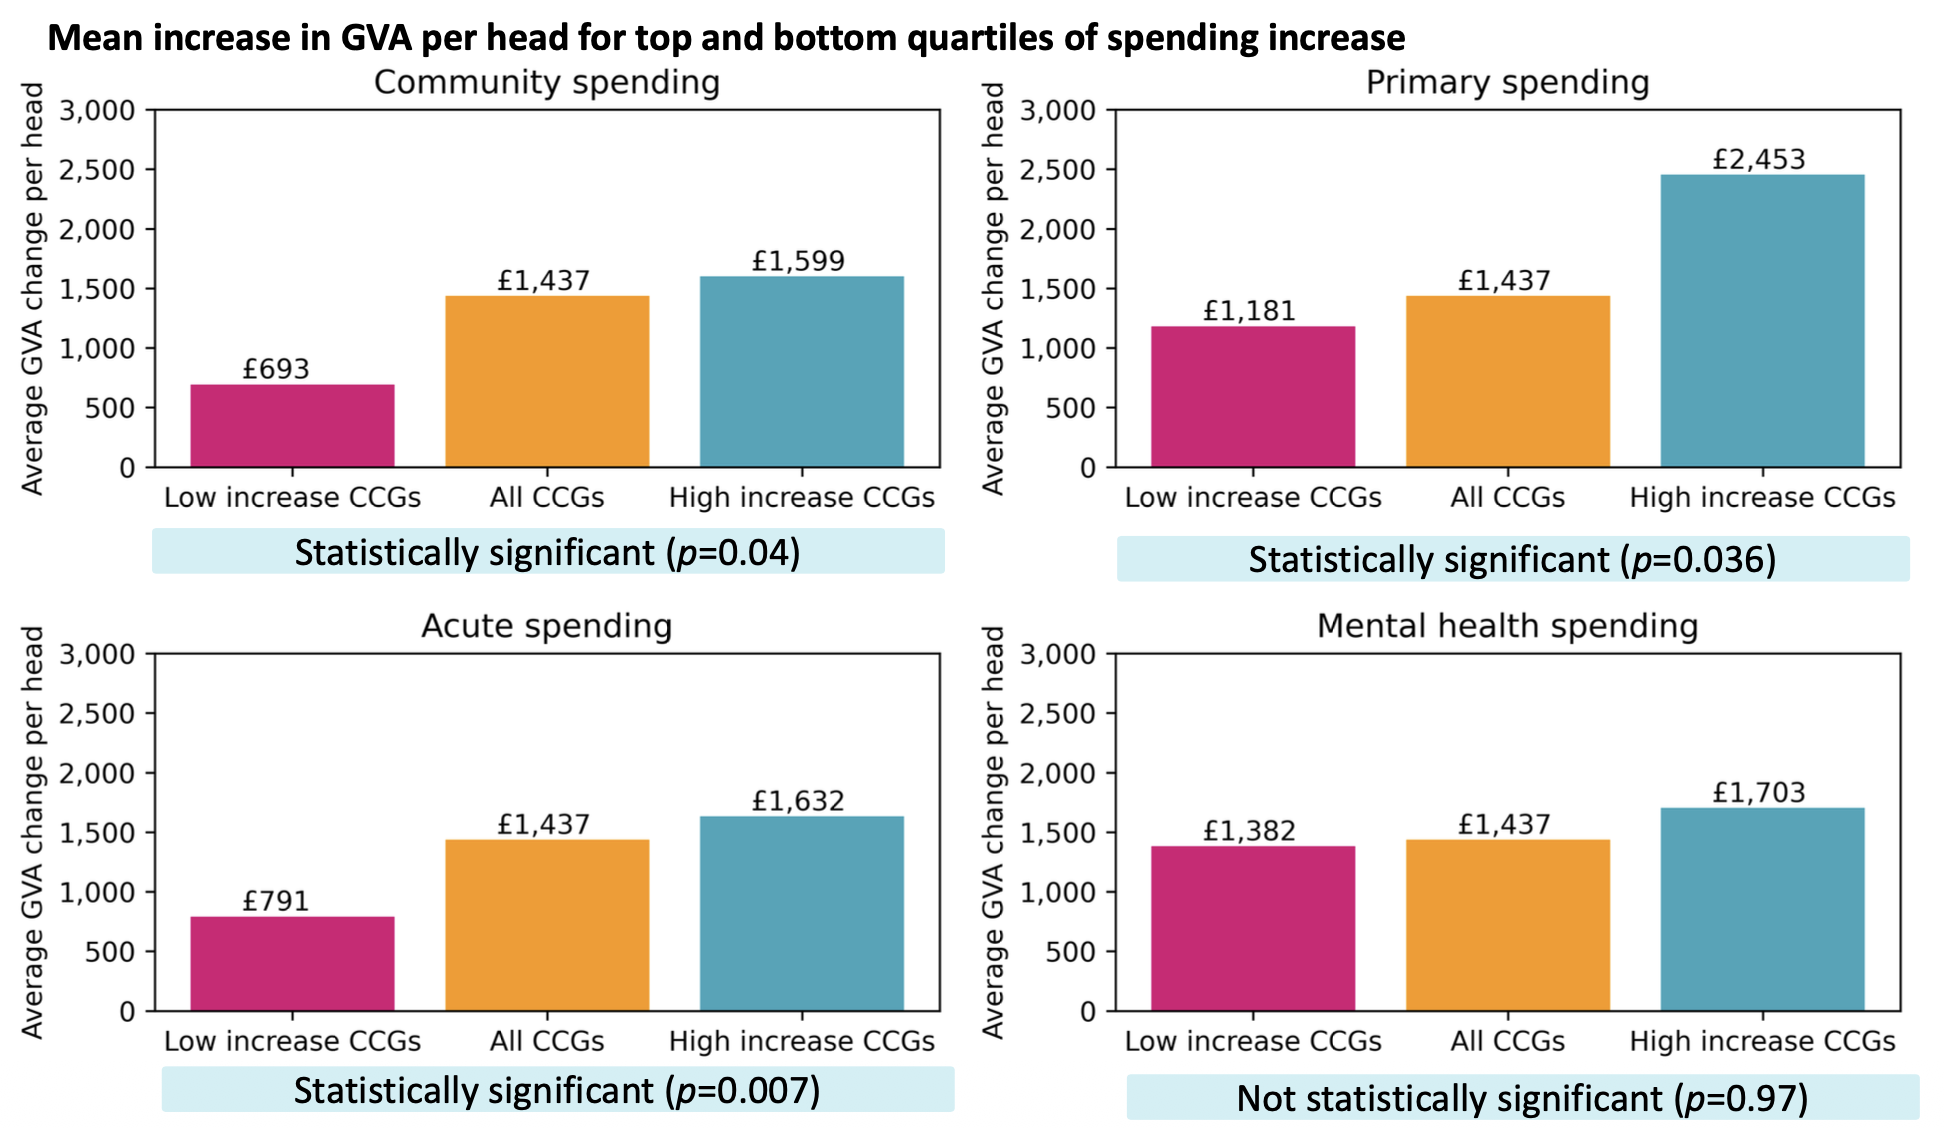
Areas that increased spend the most also increased gross value added (GVA) by more
Our analysis shows that there were statistically significant differences in GVA growth between 2015 and 2019 for groups which increased spend by the most and those which increased spend by the least, for acute, community and primary care, but not for mental health.
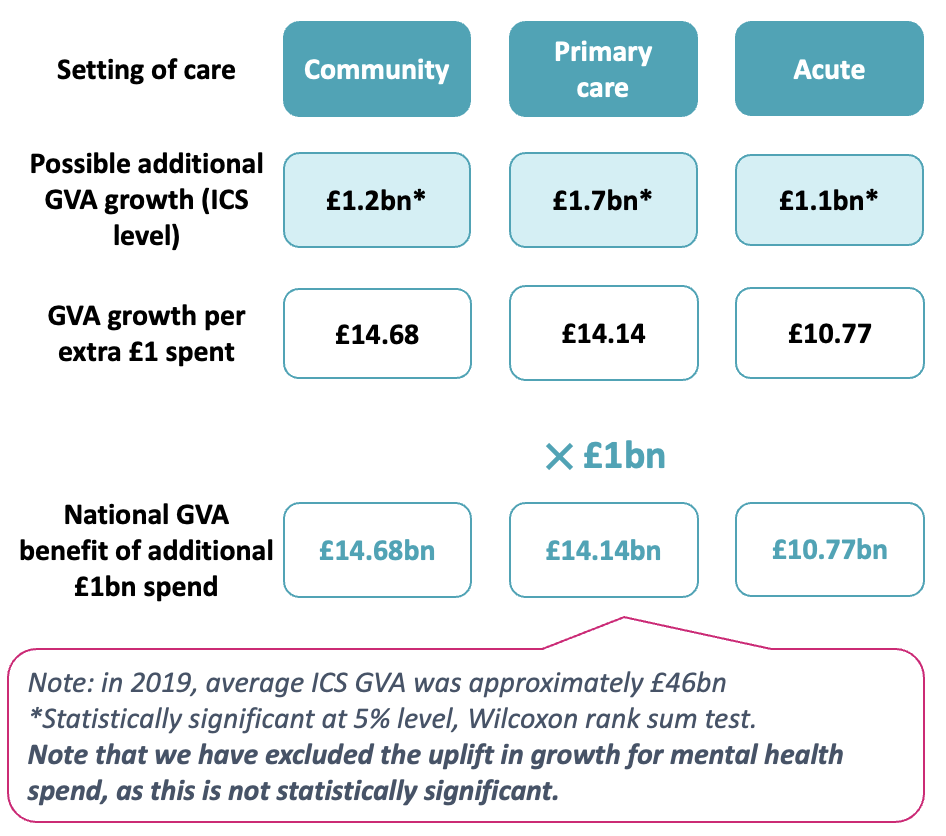
On average, those areas which increased spend by the least for each setting of care could have increased GVA by an average of at least £446m on top of the growth experienced, if all else were equal.
This effect is largest in community and primary care, where increasing spend by as much as the areas which increased spend by the most could have increased GVA growth by almost £450m and £700m, respectively, for those which increased spend by the least. We find possible benefits of more than £14 for every additional £1 required, if spend remained stable elsewhere.
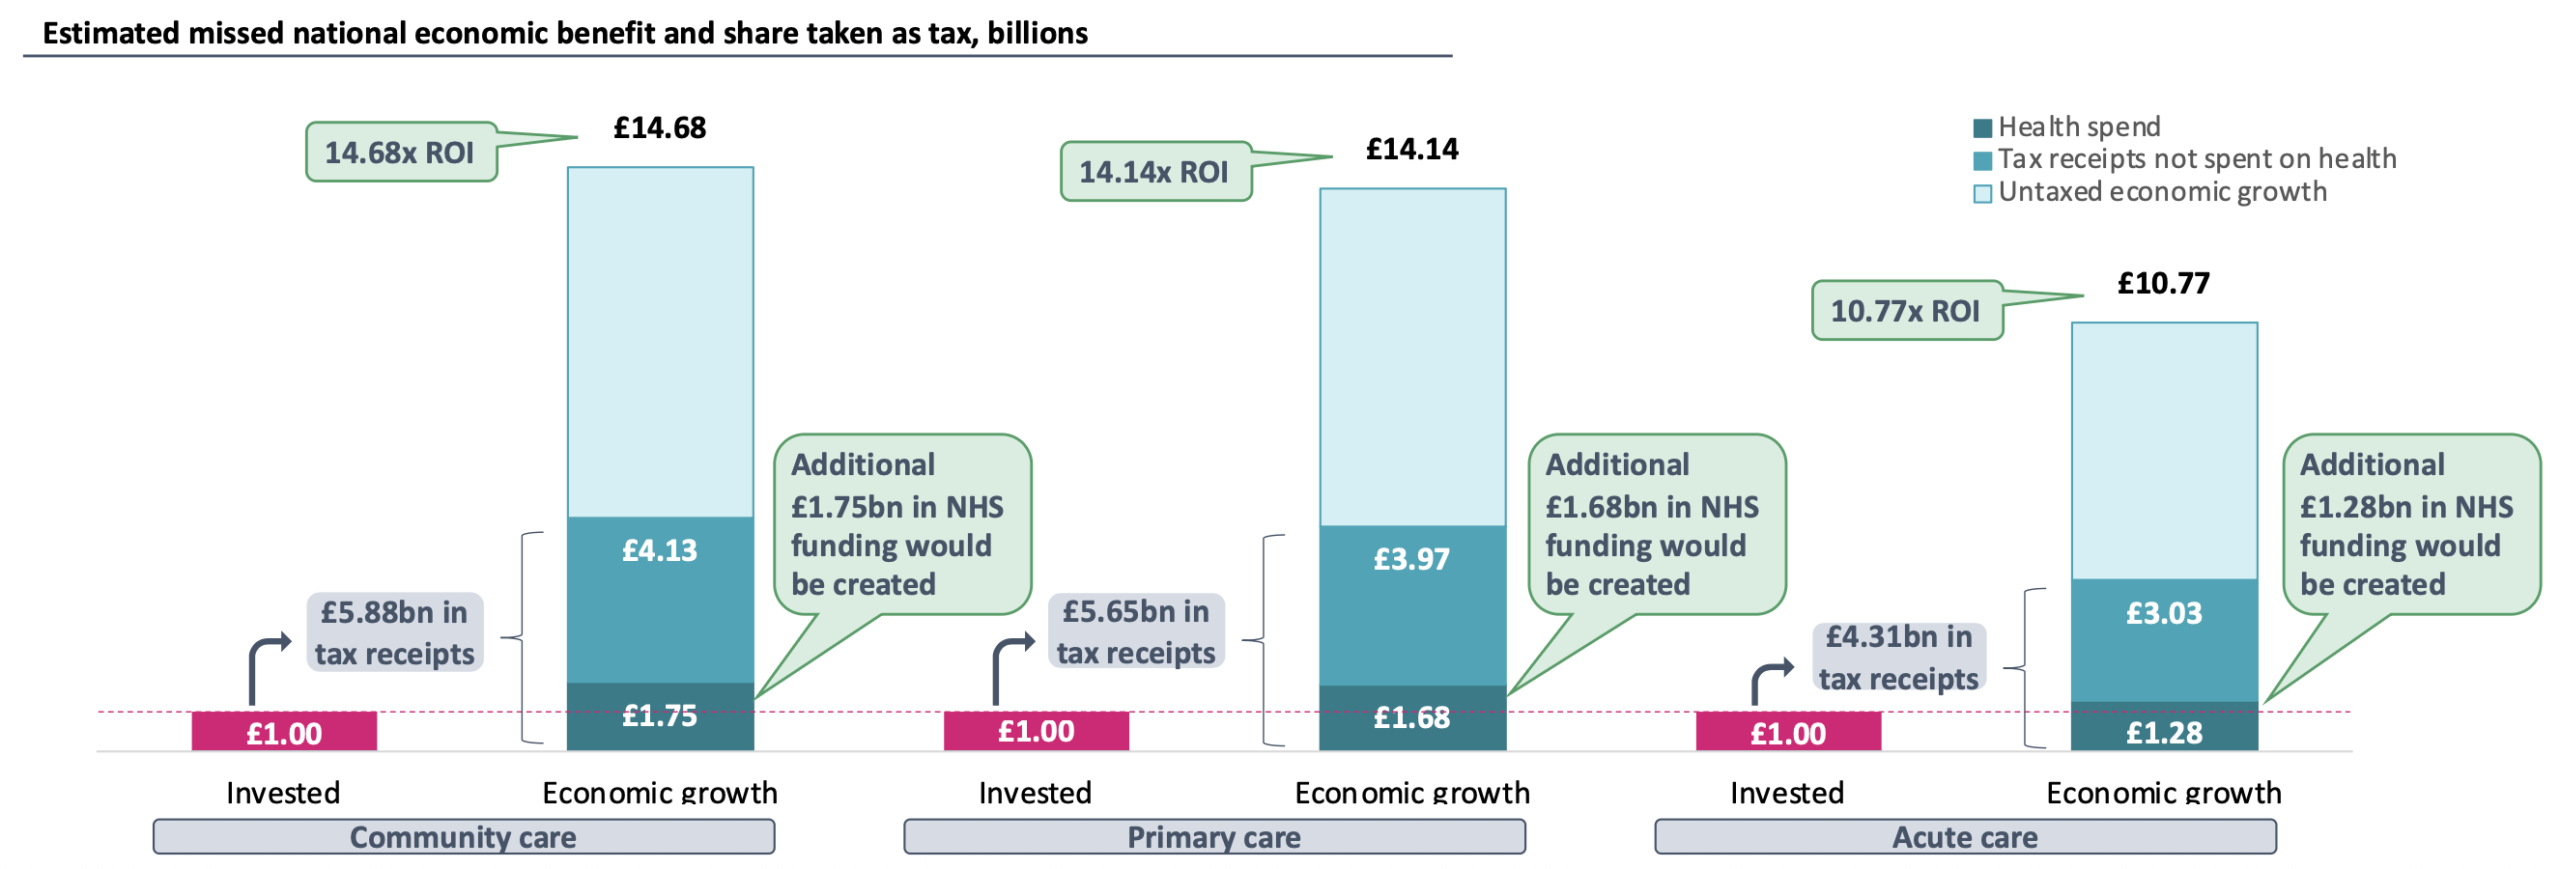
We have calculated the benefit of investing an additional £1bn (less than 1% of the national budget) to those areas which increased spend by the least. This benefit is more than £14bn to the national economy if the investment was in community or primary care.
This GVA multiplier of between £10 and £14 differs from the £4 benefit previously discovered as in this work we focused on the change in spend in a subset of CCGs and specific settings of care, as opposed to total NHS spend and its benefit to the entire economy.
We did not find a statistically significant relationship between mental health spend and GVA; we suspect this is due to the poor quality of mental health data
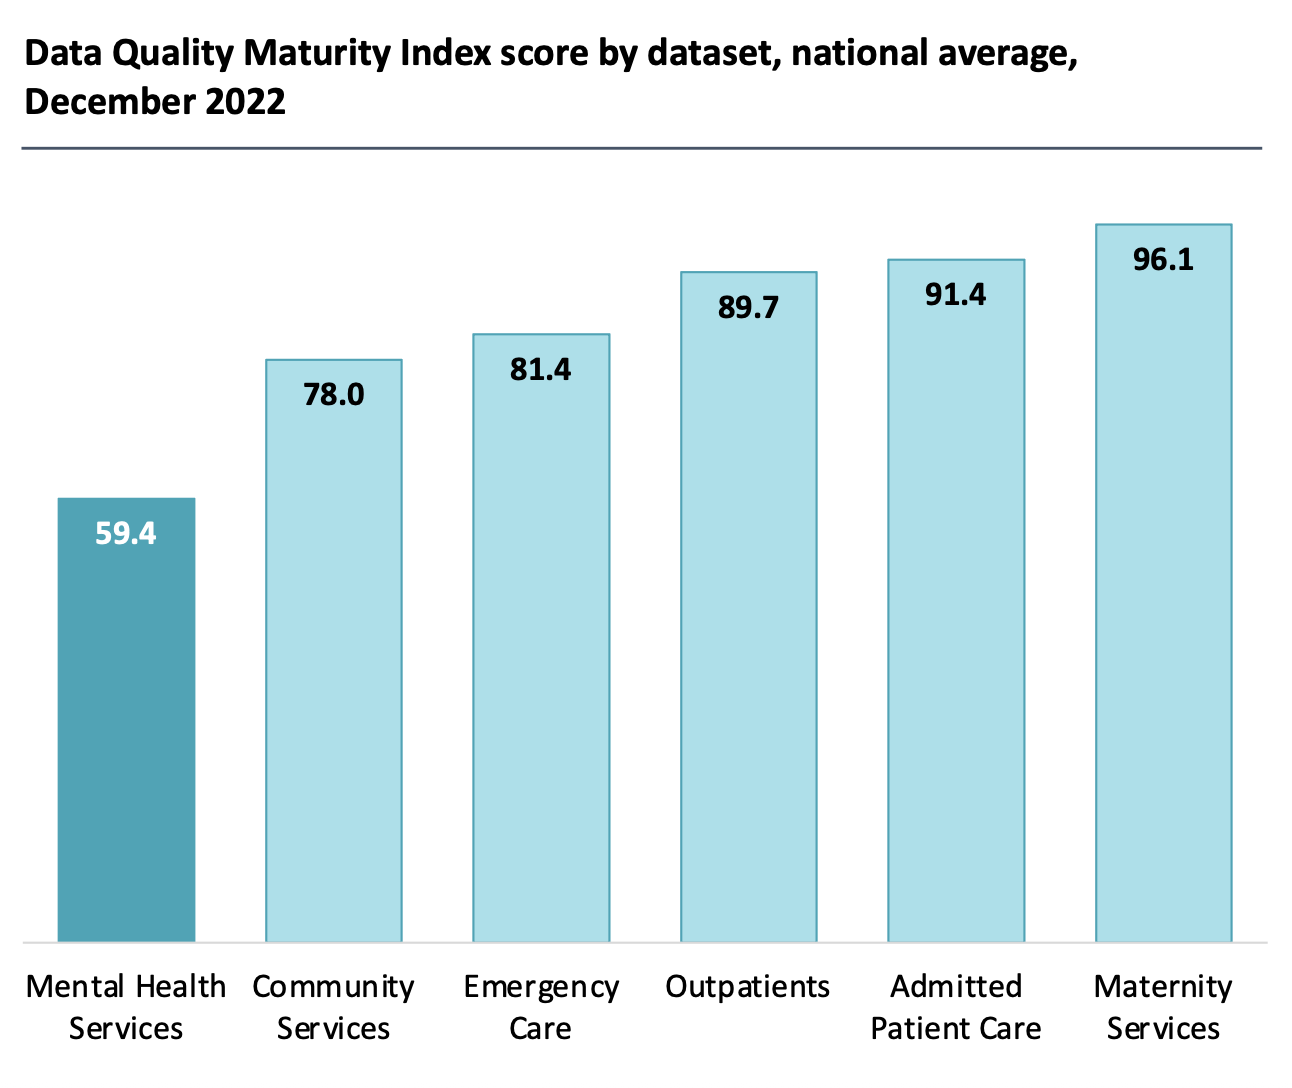
We did not find a statistically significant difference in GVA growth for high-increase areas for mental health. We hypothesise that this is, in part, due to poor data quality underlying the mental health needs index used to weight spend. Mental Health Services has the lowest Data Quality Maturity Index score of any dataset, almost 20 points lower than Community Services and at least 22 points lower than the acute datasets. We expect this poor data quality to impact the calculations of the mental health needs index and make spending decisions harder.
We estimate that an additional £1bn investment in the areas which increased spend by the least would pay for itself in community, primary and acute care
We estimate that an additional £1bn investment in community, primary or acute care, targeted in areas which increased spend by the least, could have led to additional economic growth of more than £10bn in each setting of care. This return on investment is greatest in community and primary care, indicating that investing in out-of-hospital care has the greatest economic benefits. Given tax revenues are equal to approximately 40% of the national economy, we estimate that this investment would have paid for itself in increased tax revenue. Indeed, given that NHS spending is equivalent to around 12% of GDP, this investment would have paid for itself in terms of increased NHS budget. An investment in any of the areas would have led to an increase in the budget of at least £1.28bn, a return on investment of almost 30%
We propose two potential mechanisms through which NHS spend increases local GVA
NHS leaders must understand the impact their spending decisions have on growth
The ability to increase spending that has been observed is largely the result of national allocations policy and national tariffs for hospitals, combined with local decision making. The most significant areas for influencing economic growth – community and primary care – are those which are in principle subject to significant local determination, even though within an often complex system. Given the ability of local and national organisations to influence economic outcomes through NHS spending, understanding the impact the NHS can have locally and nationally in driving economic growth is critically important.
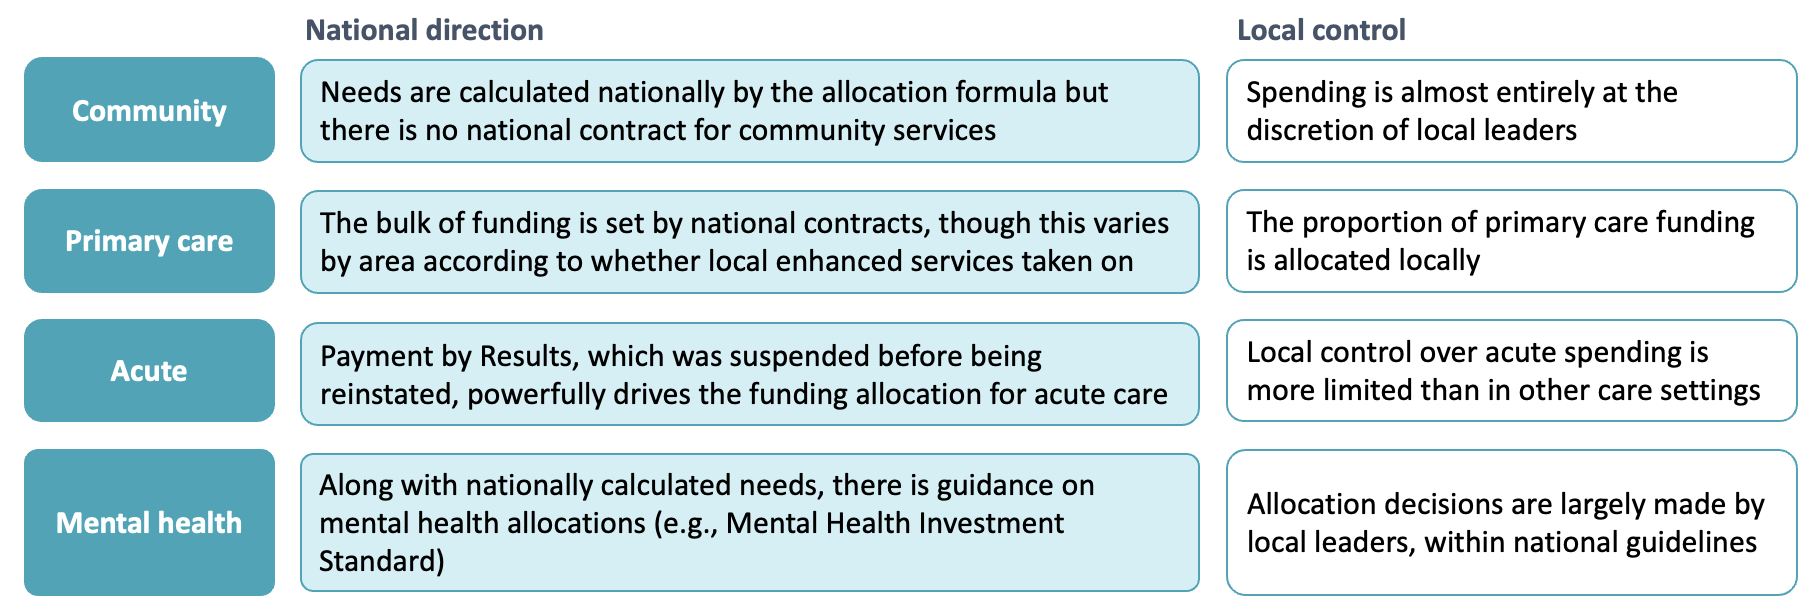
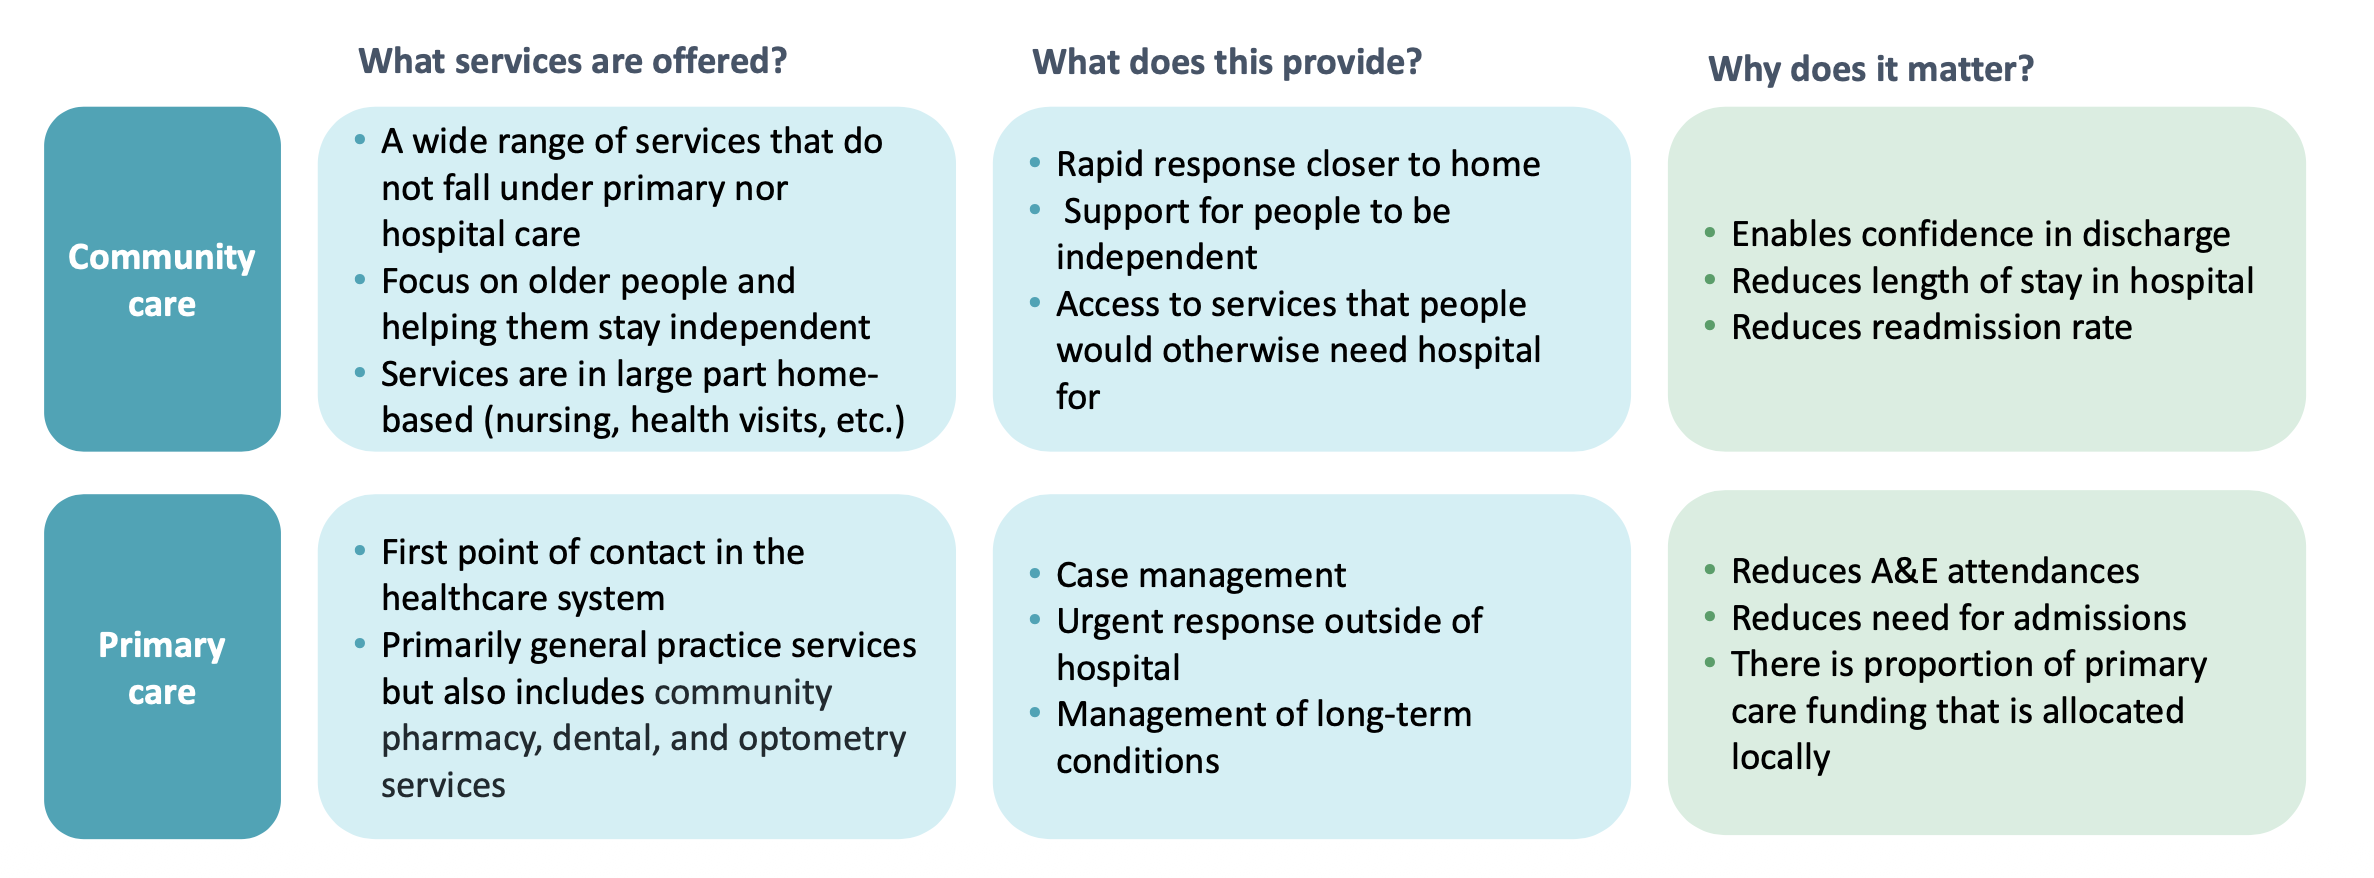
Why we think interventions in primary and community care matter
Community and primary care services have the benefit of reducing the burden on hospital services through reduced A&E attendances, and admissions, faster discharge and shorter length of stay. A strategic investment in these areas can therefore mean optimised healthcare delivery ensuring better health outcomes in general through better care offered at the right place and the right time.
Our previous work shows that increasing the primary care workforce can also create savings by reducing the need for secondary care
There is evidence that increasing the number of GPs per head leads to a decrease in the number of A&E attendances and long-stay non-elective inpatient spells. We can estimate the impact of adding one GP for 10,000 people.
The salary cost of employing an extra GP ranges between £65,070 to £98,194. With an average A&E attendance cost of £297, average non-elective (long-stay) inpatient spells cost of £4,842, the above estimates would reduce costs by £82,071 through the reduction of non-elective activity alone. Reducing the number of A&E attendances and inpatient spells is directly linked to an improvement in the population’s health, meaning that the monetary impact is likely to be significantly greater than the direct saving shown.

We believe that the two mechanisms identified will lead to quick effects of health spending, justifying a lag of only one year in examining economic effects
1. Our first mechanism supposes that an increase in NHS spend improves health. By treating patients earlier in the pathway with increased primary and community care capacity, patients become less acutely unwell, and avoid time in hospital. By improving health and avoiding time in hospital, local residents become more productive, leading to economic growth.
2. Our second hypothesis is that increased NHS spend will lead to a larger workforce, leading to increased local employment through well-documented multiplier effects in government spending. This would then lead to increased consumer spending and a boost to local businesses and employment.
We expect both mechanisms to work almost immediately, with benefits visible within one to three years. Given our earliest spend data is dated 2014/15 and that we wanted to understand the impact of a five-year change in spend, whilst avoiding the effect of Covid-19, it was impossible to examine a lag of more than one year.
This would merit further enquiry once we are further along the event horizon of the Covid-19 pandemic, the effect of which makes economic analysis of health data fraught.
In line with the above rationale, findings from our previous work on interventions to support public health management in North West London revealed a 1-3 year timeframe for these to translate into improved outcomes (e.g., average change in NEL admissions).
Implications and way forward
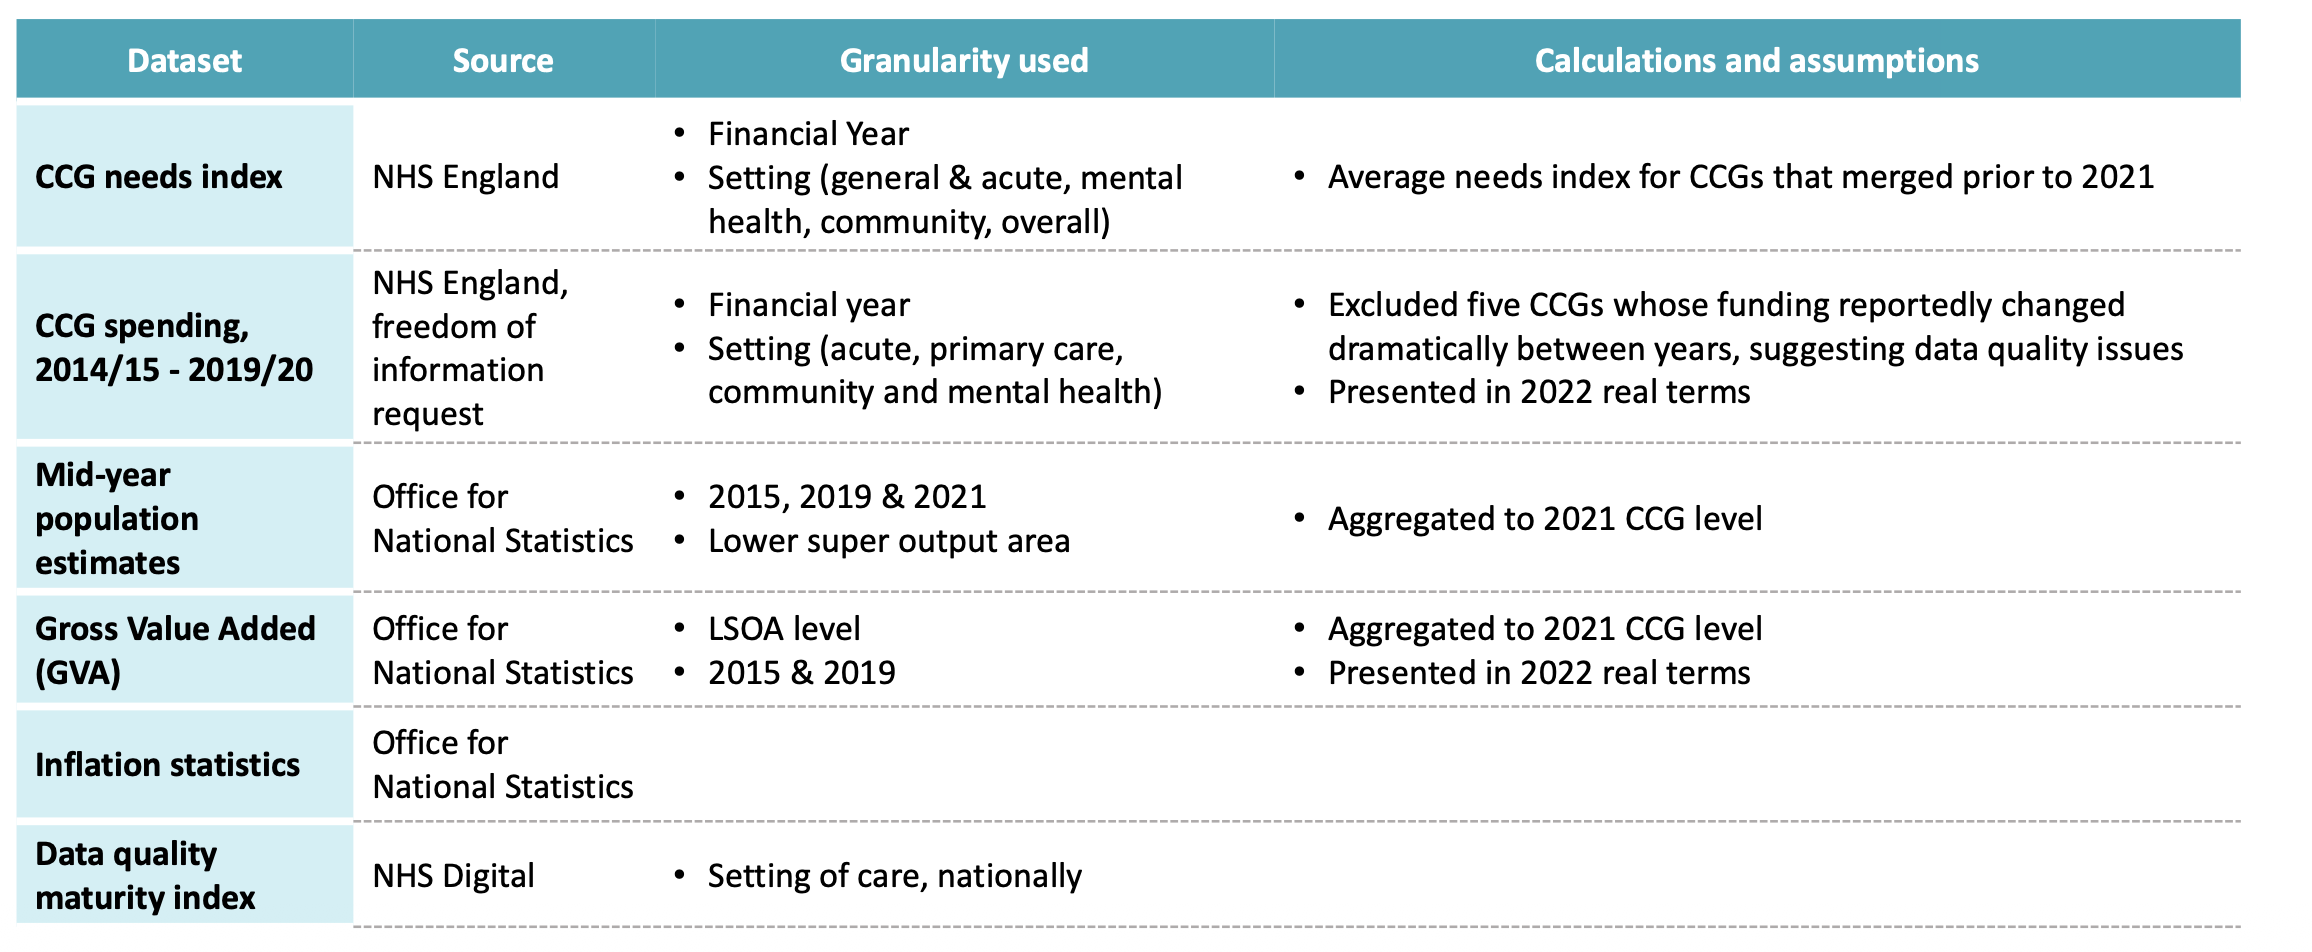
Data sources used
As part of our continued investment in data, we have developed and curated a comprehensive economy dataset which allows for analysis of NHS interventions and their effect on the local economy. We believe this dataset and accompanying analysis to be unique.
Click here to explore the research further.
Click here to read Confed’s report.
Find the NewStateman’s coverage of the research here.